Potential output in times of temporary supply shocks
Prepared by Guzmán González-Torres, José Emilio Gumiel and Béla Szörfi
Published as part of the ECB Economic Bulletin, Issue 8/2023.
According to the estimates of major international institutions, the euro area output gap has remained negative or very close to zero in recent years, despite the rise in euro area core inflation.[1] Motivated by policy considerations related to fiscal, financial and external sustainability, the potential output estimates produced by international institutions such as the International Monetary Fund (IMF), the Organisation for Economic Co-operation and Development (OECD) and the European Commission are computed under the assumption that potential output mostly only fluctuates in response to medium-run – i.e. either permanent or highly persistent – structural shocks.[2] This approach was maintained during the pandemic and the associated supply shock, which many assumed would be transitory given the reversal of containment measures and the supporting role of macroeconomic policies.[3]
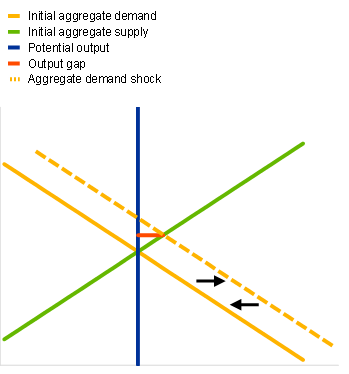
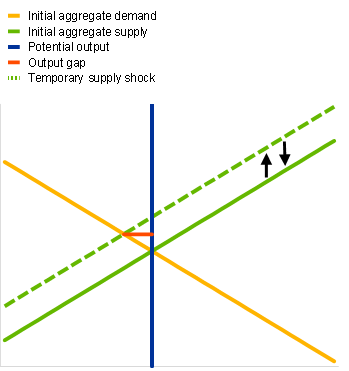
A simple aggregate demand-aggregate supply model illustrates how temporary supply shocks, which do not alter potential output, create output gaps negatively correlated with inflation.[4] The model predicts that positive aggregate demand shocks create positive output gaps while pushing up both output and inflation (Chart A, panel a). At the same time, temporary adverse supply-side shocks – that is, supply shocks that cause inflation but do not alter potential output – push output below potential. In other words, these shocks cause negative output gaps (Chart A, panel b). A simultaneous fall in output and rise in inflation that does not lead to a negative output gap can only be achieved if potential output falls at least as much as output. If potential output is not affected, and assuming there are no significant second-round effects from increasing wages, inflation will go back to the initial level. In the first case the output gap will converge to zero from a positive level, while in the second it will go back to zero from a negative level.
Chart A
Simple aggregate demand-aggregate supply model
|
a) Aggregate demand shock |
b) Temporary aggregate supply shock |
|---|---|
| (x-axis: output; y-axis: inflation) | (x-axis: output; y-axis: inflation) |
 |
 |
Source: ECB staff.
Notes: The chart illustrates the aggregate supply-aggregate demand model,[5] with output on the x-axis and inflation on the y-axis. The aggregate supply schedule represents the inflation rate that would result from firms’ pricing decisions at any given production level in the short run. The aggregate supply schedule shifts upwards (downwards) in response to changes in firms’ cost structures – such as increases (decreases) in input prices, decreases (increases) in input availability and decreases (increases) in productivity – as well as to increases (decreases) in firms’ inflation expectations. The aggregate demand schedule represents the amount of goods and services demanded by households, firms, governments and the external sector in the short run at any given level of inflation. The aggregate demand schedule shifts outwards (inwards) in response to a variety of demand shocks, for example increases (decreases) in household income, decreases (increases) in investment costs, increases (decreases) in government spending, or exchange rate depreciations (appreciations). The assumed temporary nature of the shocks depicted prompt the corresponding schedules to first shift outwards (upwards) and then back to their original positions. The output gap is measured as the horizontal distance between the equilibrium level of output and potential output. The latter is assumed to remain unchanged throughout.
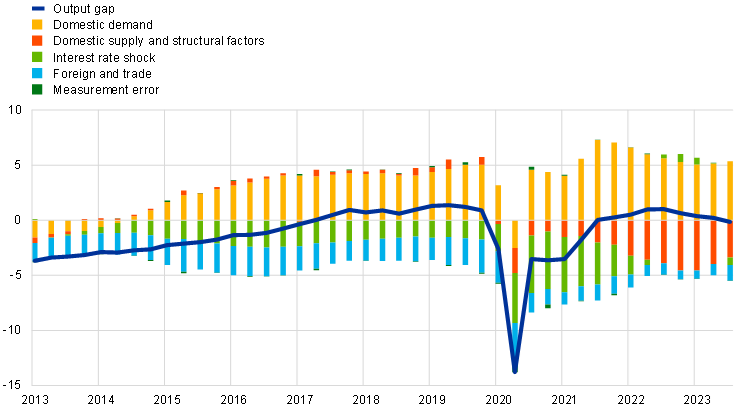
Structural models, such as the New Area-Wide Model (NAWM), can help illustrate the effects of supply shocks on potential output.[6] The NAWM is used to provide a decomposition of the European Commission’s output gap, which is imposed as an observed variable. This set-up separately identifies supply and demand drivers (Chart B), among other factors. The decomposition shows how considering potential output to be relatively smooth leads the model to identify the recently observed supply shocks as negative contributors to the output gap. It also suggests that supply shocks played a limited role in the run-up to the pandemic, with demand shocks dominating. All in all, the predominance of supply shocks would seemingly be an exceptional occurrence from a historical perspective.
Chart B
NAWM-based shock decomposition of the European Commission’s interpolated output gap estimate
(x-axis: quarters; y-axis: percentage of potential output and percentage contributions)
Sources: The European Commission’s Autumn 2023 Economic Forecast and ECB staff calculations.
Notes: The European Commission does not provide quarterly output gap estimates. Their annual output gap estimates have therefore been interpolated into quarterly frequency by ECB staff. The category “Domestic supply and structural factors” includes the contributions of the initial state, the model’s discount rate shock, the permanent technology shock, the transitory and investment-specific technology shocks as well as wage and price mark-ups. “Interest rate shock” comprises the short-term interest rate shock and the shock to the retail bank’s markdown. “Domestic demand” includes the domestic risk premium shock and the shock to government spending. The category “Foreign and trade” captures shocks to foreign demand, foreign prices, US three-month and ten-year interest rates, competitors’ export prices, oil prices, import demand, export preferences, mark-up shocks to export and import prices, and a foreign risk premium shock.
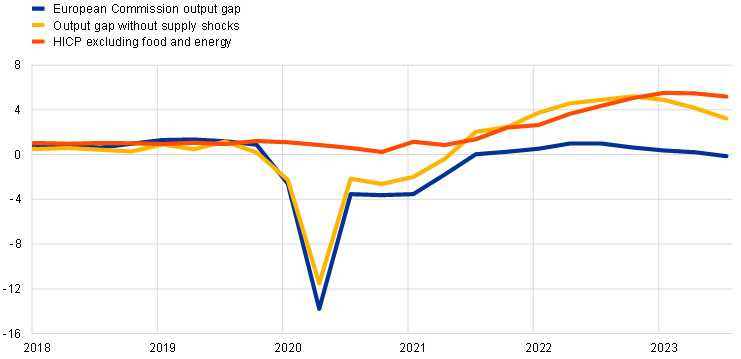
Adjusting the output gap estimates for the above-identified supply shocks would make the former more positive for the years 2021-2023, although this would result in a more volatile potential output estimate. This would be a direct consequence of the assumption that the supply shocks identified by the NAWM were of a more permanent nature than implied by the above decomposition and therefore mostly absorbed by the level of potential output rather than the output gap (Chart C, panel a). The potential output estimate resulting from this thought experiment falls in 2020 and then again in 2022 because of transitory supply shocks, significantly increasing its volatility (Chart C, panel b).
Chart C
Accounting for temporary supply shocks in the European Commission’s potential output estimate
a) Alternative output gap estimates and HICPX inflation
(x-axis: quarters; y-axis: percentage of potential output, annual percentage change)
b) Alternative potential output estimates and real GDP
(x-axis: quarters; y-axis: log levels)
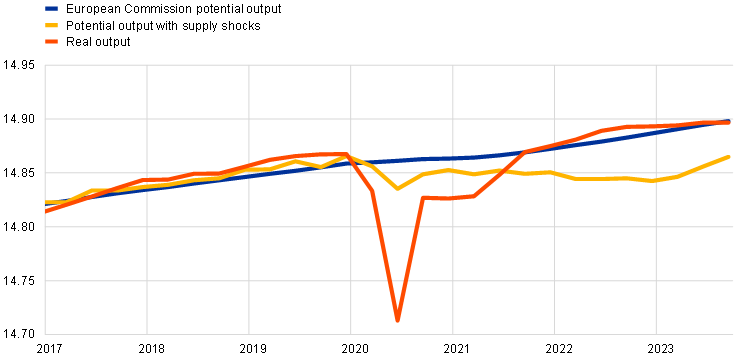
Sources: The European Commission’s Autumn 2023 Economic Forecast and ECB staff calculations.
Notes: The “Output gap without supply shocks” series shows the European Commission’s output gap once the supply shocks identified by the NAWM in Chart B have been subtracted. The “Potential output with supply shocks” series shows the implicit potential output estimate resulting from the aforementioned output gap estimate.
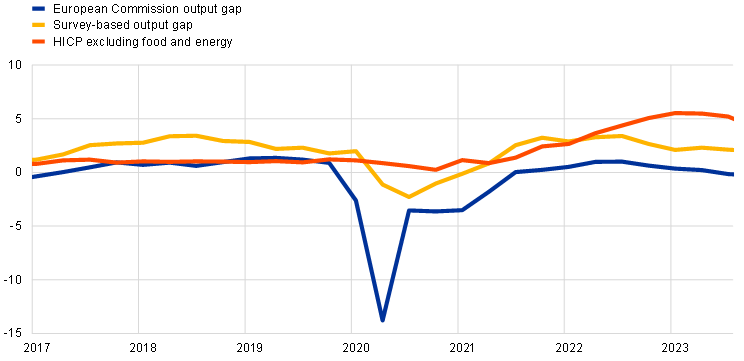
Survey-based measures of slack capture capacity utilisation or the relative strength of demand without the need for an economic model. Such measures provide empirical guidance on the extent to which transitory changes to firm-level productive capacity affect the inflation-relevant potential output level. Surveys enquiring about the degree of capacity utilisation of firms show that firms in manufacturing, services and construction were producing at relatively high capacity at the onset of the pandemic, while during the pandemic they were operating at less of a reduced capacity utilisation than indicated by the standard output gap estimates.[7] Capacity utilisation rebounded quickly in 2021 and reached historical highs by early 2022. It eased significantly in manufacturing in 2022-2023 (albeit staying above the historical average), while remaining strong in services and construction.
Slack measures derived from firm-level surveys better reflect the inflation dynamics of recent years, but they deliver more volatile trend output counterparts. Capacity utilisation co-moves rather strongly with HICP inflation excluding food and energy, suggesting ongoing, though partly declining, upward pressure on core inflation (Chart D, panel a). An econometric analysis using a reduced-form Phillips curve confirms that the survey-based slack measure produces somewhat smaller short-term inflation forecast errors for the recent high-inflation period. However, slack indicators based on firm-level surveys deliver an even more volatile trend output for during the pandemic than the slack measure constructed using the NAWM exercise (Chart D, panel b). This suggests that these indicators may not be suitable to provide estimates of medium-term potential output.
Chart D
Comparison between a survey-based slack measure and the European Commission’s output gap estimate
a) Alternative output gap measures and HICPX inflation
(x-axis: quarters; y-axis: percentage of potential output, annual percentage change)
b) Alternative potential output measures and real GDP
(x-axis: quarters; y-axis: log levels)
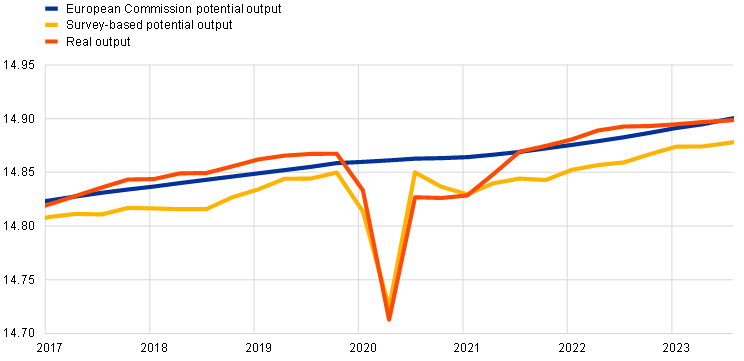
Sources: The European Commission’s Autumn 2023 Economic Forecast, ECB staff and the European Commission’s business surveys.
In conclusion, alternative estimates of potential output and the output gap may complement the medium-term estimates of major international institutions at certain times. The proposed complementary measures of slack seem to provide better short-term forecasts of inflation in times of temporary supply shocks than an output gap estimate based on a smooth notion of potential output. However, caution should be taken in interpreting the slack-based estimates as measures of the phase of the business cycle, as the derived potential output estimates are more volatile, possibly providing less information regarding the medium-term growth prospects of the economy.
-
See “Autumn 2023 Economic Forecast: an improved outlook amid persistent challenges”, European Commission, Brussels, May 2023, “World Economic Outlook: Navigating Global Divergences”, IMF, Washington D.C., October 2023, and “Economic Outlook: Restoring growth”, OECD, Paris, November 2023.
-
See Chalaux, T. and Guillemette, Y., “The OECD Potential Output Estimation Methodology”, Economics Department Working Papers, No 1563, OECD, Paris, 2019, Havik, K. et al., “The Production Function Methodology for Calculating Potential Growth Rates and Output Gaps”, Economic Papers, 535, European Commission, Brussels, November 2014, and De Resende, C., “IEO Evaluation Report”, IMF Forecasts, Independent Evaluation Office of the International Monetary Fund, Washington D.C., April 2014, Chapter 5.
-
For more details, see the article entitled “The impact of COVID-19 on potential output in the euro area”, Economic Bulletin, Issue 7, ECB, Frankfurt am Main, 2020.
-
Macroeconomic theory encompasses a variety of notions of potential output that differ in the degree to which they balance capturing the relatively stable long-run level of production at the expense of signalling inflationary pressures in the presence of temporary shocks to the economy’s productive capacity. See for example Vetlov, I., Hlédik, T., Jonsson, M., Kucsera, H. and Pisani, M., “Potential Output in DSGE Models,” Working Paper Series, No 1351, ECB, Frankfurt am Main, 2011. International institutions typically measure potential output as the highest level of economic activity that can be sustained over the long term. Accordingly, these potential output measures reflect a medium to long-term view of output, with growth rates that move relatively slowly over time. The difference between actual output and potential output is referred to as the output gap, which reflects the cyclical position of the economy. In normal times – that is, when demand shocks dictate the phase of the economy – the output gap is thought to signal short-term inflationary pressures.
-
See for example Robert, F., Bernanke, B., Antonovics, K. and Heffetz, O., “Principles of Economics”, Eight Edition, McGraw-Hill Education, New York, NY, 2022.
-
The NAWM is a dynamic stochastic general equilibrium model used during ECB projection exercises. See Coenen, G., Karadi, P., Schmidt, S. and Warne, A., “The New Area-Wide Model II: an extended version of the ECB’s micro-founded model for forecasting and policy analysis with a financial sector”, Working Paper Series, No 2200, ECB, Frankfurt am Main, November 2018.
-
The European Commission’s business surveys measure the average level of firm capacity utilisation as well as the main economic factors limiting production: demand, labour, other inputs (materials, equipment and space), financial constraints, the weather, other, or none of the aforementioned factors. While capacity utilisation is only available for both manufacturing and services starting in 2011, the series for some of the limiting factors are available for both sectors and construction starting in 2003. Out of these, demand as a limiting factor of production has a high correlation with capacity utilisation. The latter is thus used as a proxy for measuring slack.
Related topics
Poslední zprávy z rubriky Makroekonomika:
Přečtěte si také:
_w60h45_w76h50.png)
Prezentace
29.04.2024 Daňové přiznání lidem provětralo peněženky....
26.04.2024 Historie a vývoj vodovodních baterií: Od...
25.04.2024 Pobřeží Egejského moře - ideální tip na všechny...
Okénko investora

Olívia Lacenová, Wonderinterest Trading Ltd.

Štěpán Křeček, BHS

Petr Lajsek, Purple Trading

Ali Daylami, BITmarkets

Michal Brothánek, AVANT IS

Miroslav Novák, AKCENTA
Spotřebitelská inflace v eurozóně odeznívá, pro služby to však úplně neplatí

Jiří Cimpel, Cimpel & Partneři

Jakub Petruška, Zlaťáky.cz

