Explaining the resilience of the euro area labour market between 2022 and 2024
Explaining the resilience of the euro area labour market between 2022 and 2024
Prepared by Clémence Berson, Vasco Botelho, António Dias da Silva, Claudia Foroni, Matthias Mohr, Christofer Schroeder and Marco Weissler
1 Introduction
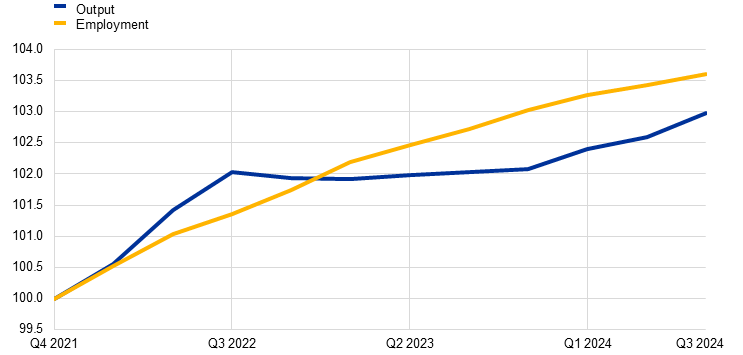
In the aftermath of the pandemic, the euro area labour market has shown remarkable resilience. The unemployment rate has remained at record lows and employment has grown steadily despite weak economic growth and various challenges to the economy, such as the energy crisis triggered by Russia’s invasion of Ukraine, geopolitical tensions and the subsequent monetary policy tightening. From the fourth quarter of 2021 to the second quarter of 2024, cumulative employment growth (3.3%) outpaced cumulative real GDP growth (2.4%) by 0.9 percentage points. This is remarkable given that both employment and output had fully recovered to their respective pre-pandemic levels by the end of 2021. The resilience of employment has, however, led to a decline in labour productivity growth, measured in terms of average output per employee, which has dipped below its already weak historical trend.
Higher profit margins and lower real wages, together with lower average hours worked per employee, have allowed firms to hire more workers and retain staff during weak economic growth, while increased labour force participation has helped address potential labour shortages. The surge in inflation at the onset of the energy crisis significantly reduced real wages, making hiring less costly for firms. This created incentives for them to favour labour input, given rising prices for energy and intermediate inputs, thereby contributing to resilient labour market dynamics during a period of weak economic growth. Additionally, substantially higher profit margins allowed firms to hire additional workers or maintain their current labour force. Faced with actual, or expected, labour shortages, firms chose to retain their workers, seeing labour hoarding as a less costly option than seeking replacement workers upon recovery from what was regarded as a temporary weak economic environment. Lower average hours worked per employee, amid still robust labour demand, encouraged companies to hire more workers to maintain their overall labour input. Recent survey evidence suggests that labour hoarding was one of the factors behind the decline in average hours worked per employee, with firms reducing working time in response to what they perceived as temporary lower demand. Moreover, sustained labour force growth in the post-pandemic period has incentivised firms to get new workers on board to address actual or expected labour shortages. The labour force participation rate has risen above pre-pandemic levels, driven primarily by transitions from inactivity to employment. Women, older workers, persons with a higher education and foreign workers have contributed the most to this increase. Faced with the possibility of labour shortages, firms hired these additionally available workers by way of precaution, despite subdued economic activity.
This article closely examines each of these four factors, focusing on labour market dynamics in the euro area as a whole. The favourable aggregate dynamics reveal increasing heterogeneity across sectors, with low productivity sectors driving the aggregated data. While recognising the significant differences at the country level, analysing the euro area labour market at the aggregated level is key to a comprehensive understanding of the real economy and of the choices made by firms and workers that determine price and wage inflation. It also provides the ECB with important insight, which it needs to make effective policy decisions in line with its price stability mandate.
2 Post-pandemic labour market developments
The post-pandemic period was characterised by a remarkably robust labour market in the euro area. The recovery in economic activity following the pandemic was swift and accompanied by strong growth in employment. This stands in contrast to the periods following the global financial crisis and the euro area sovereign debt crisis, which saw slower employment growth despite a rebound in economic activity. By the end of 2021, the number of workers in job retention schemes – a feature of labour markets during the pandemic – came down significantly, pointing to the absence of hysteresis effects in the labour market and of any significant need for major job reallocation in the euro area.[1] Even the slowdown in economic activity following Russia’s invasion of Ukraine, and the resulting spike in energy prices, had no visible negative impact on the labour market.
The euro area labour market’s performance has been exceptional as compared with changes in output (Chart 1, panel a). The relationship between employment and output growth, known as Okun’s law, suggests that employment and GDP developments were broadly aligned in 2022, while a gap emerged in 2023. In the third quarter of 2024, the difference between actual employment and that suggested by GDP growth, rose to nearly 600 thousand workers, or around 0.35% of persons employed. The strong growth in employment in comparison with GDP was supported by firms retaining their workers, facilitated by rising corporate profits, declining real wages and lower average hours worked per person employed, as well as by robust growth in the labour force (Chart 1, panel b).[2] The fall in the average hours worked reflects the fact that the total hours worked has risen only modestly since late 2019 compared with the increase in the number of persons employed – a development which is discussed in detail in Section 5 of this article.
Strong employment growth and weak GDP dynamics have led to a decline in productivity growth. The slowdown in productivity growth predates the pandemic but has gathered pace since 2022, under the combined effect of various adverse shocks to the euro area.[3] Quarter-on-quarter productivity growth turned negative in the fourth quarter of 2022 and has remained well below its pre-pandemic trend since then. On a cumulative basis, it has declined by 1.3% since the fourth quarter of 2021. Recently, however, there have been signs that the fall in labour productivity is slowing, given that quarter-on-quarter growth has been zero or slightly positive since the first quarter of 2024.
The trends for aggregate employment and productivity mask heterogeneity across sectors. While employment growth was most prominent in the construction, public, and professional services sectors, it was weak in the manufacturing sector. Gross value added also developed differently across sectors, as did productivity. Strong growth in employment in the public and construction sectors between the fourth quarter of 2019 and the second quarter of 2024 (8.9% and 7.1% respectively) outpaced that of gross value added (2.3% and 3.0% respectively), leading to a pronounced slowdown in productivity growth in these two sectors. By contrast, information and communication services saw a substantial increase in productivity growth, driven by robust growth in gross value added. For some sectors, changes in productivity growth evolved into two distinct phases: the acute pandemic period, from the fourth quarter of 2019 to the fourth quarter of 2021, and the post-pandemic period after the first quarter of 2022. In the manufacturing sector, for example, cumulative growth in productivity per person and per hour stood at 8.6% and 7.8% respectively during the acute pandemic period. With the spike in energy prices in 2022, however, productivity growth turned negative and cumulative growth in productivity per person and per hour in the post-pandemic period fell to -2.4% and -2.9% respectively. Contact-intensive service sectors, such as the hospitality and food services industries, also saw growth in productivity of 1.6% per person and per hour during the acute pandemic period. While cumulative growth in productivity per person in these sectors remained positive during the post-pandemic period, rising to 1.6%, productivity growth per hour declined by 0.1%.
Chart 1
Labour market developments
a) Growth in real GDP and employment
(index: Q4 2021 = 100)
b) Growth in the labour force and contributions from employment and unemployment
(contributions and percentages)
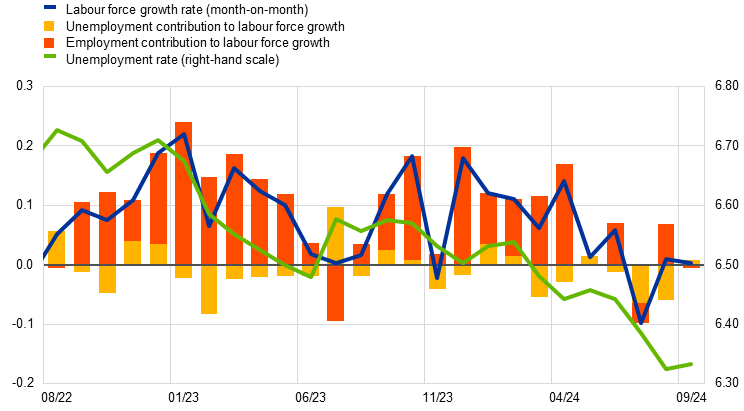
Sources: Eurostat and ECB calculations.
Note: The latest observations are for the third quarter of 2024 for growth in real GDP and employment (panel a) and for September 2024 for growth in the labour force (panel b).
The unemployment rate has remained at record lows. In September 2024 the unemployment rate in the euro area stood at 6.3% – the lowest ever to be recorded since the introduction of the euro and 1.1 percentage points below the pre-pandemic level observed in January 2020. The decline in the unemployment rate was broad-based across countries, with some variations. Spain and Italy, for example, experienced the largest reductions in unemployment rates over this period (-2.6 percentage points and -3.5 percentage points respectively), whereas Germany saw a slight rise (+0.3 percentage points). The fall at the euro area level was driven by a slight drop in the number of unemployed, of around 1.3 million persons, coupled with a significant increase in the labour force of 8.6 million compared with January 2020.
Chart 2
The Beveridge curve
(x-axis: unemployment rates; y-axis: vacancy rates)
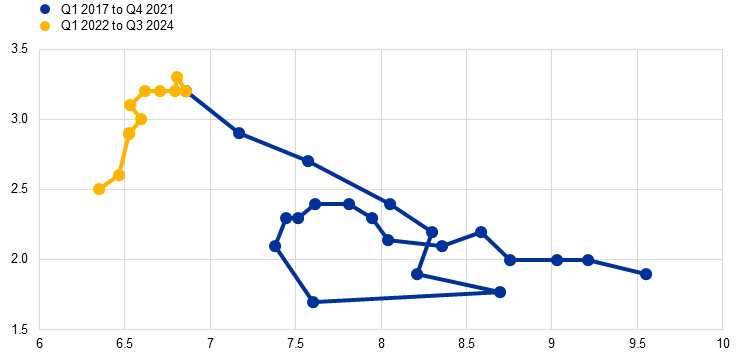
Source: Eurostat.
Note: The latest observations are for the third quarter of 2024.
Labour demand has remained robust over the post-pandemic period, albeit it has started to ease more recently. The job vacancy rate spiked at 3.3% in the second quarter of 2022, pointing to a tight labour market, despite a deterioration in matching efficiency as regards job vacancies and job seekers. Since then, this rate has gradually declined, having fallen to 2.5% in the third quarter of 2024 – only 0.2 percentage points higher than its pre-pandemic level. Waning labour demand in recent quarters, coupled with a stable unemployment rate, has resulted in a vertical Beveridge curve and improved efficiency matching (Chart 2).
Box 1
Labour market developments in the euro area compared with other advanced economies
Prepared by António Dias da Silva, Ramon Gomez-Salvador, Isabella Moder and Matthias Mohr
The growth rate of total hours worked in the euro area between the first quarter of 2022 and the second quarter of 2024 compares favourably with that of the United Kingdom and of the United States.[4] From a structural perspective, however, the euro area has a much higher unemployment rate and much lower participation and employment rates than in the United Kingdom and the United States.
Labour input increased by around 3% in the euro area and the United States, but was more contained in the United Kingdom at around 1.5% (Chart A).[5] Population growth and increases in labour force participation rates were both factors contributing to the rise in hours worked in the euro area and the United States. By contrast, average hours worked declined in the euro area but increased in the United States, while the employment rate rose in the euro area and fell in the United States. For the United Kingdom, two key factors pulled down total hours worked: first, a decline in the labour force participation rate and, second, a fall in the employment rate. Conversely, the contribution of population growth was significantly stronger in the United Kingdom than in the euro area or the United States.
Chart A
Labour market contributions to total hours worked
(cumulative percentage changes between Q1 2022 and Q2 2024, and percentage point contributions)
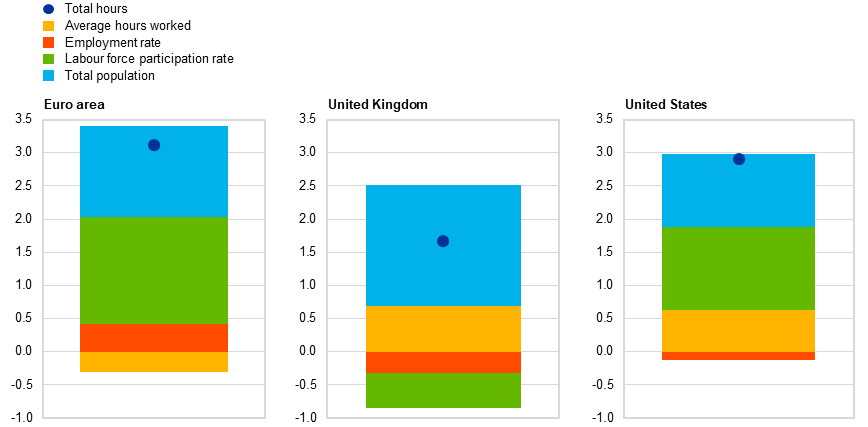
Sources: OECD, Eurostat, UK’s Office for National Statistics and US Bureau of Labor Statistics.
Changes in key labour market variables over time show that the labour market in the euro area has remained relatively robust in recent quarters (Chart B). The participation rate in the euro area has continued to increase, albeit at a slower pace in the first half of 2024. The employment rate has been steadily rising, in contrast to the United States, where it has noticeably slowed down, and in the United Kingdom, where it has remained broadly unchanged during this period. While the unemployment rate continues to decline in the euro area, it has begun to rise in both the United Kingdom and the United States.
Chart B
Key labour market variables in the United States, United Kingdom and the euro area
(percentages)

Sources: OECD, Eurostat, UK’s Office for National Statistics and US Bureau of Labor Statistics.
Note: The latest observations are for the third quarter of 2024 for the United States and the United Kingdom, for the third quarter of 2024 for the euro area unemployment rate, and for the second quarter of 2024 for the euro area participation rate and employment rate.
Overall, the euro area labour market requires structural improvements if it is to achieve the levels of employment, participation and unemployment observed in the United Kingdom and the United States. Recent developments show that some progress has been made, given that the labour market in the euro area is seeing higher employment and participation rates and a stronger decline in the unemployment rate. However, improvements in the euro area labour market may become more difficult to achieve if weak productivity prevails.
3 The role of factor substitution in explaining employment dynamics
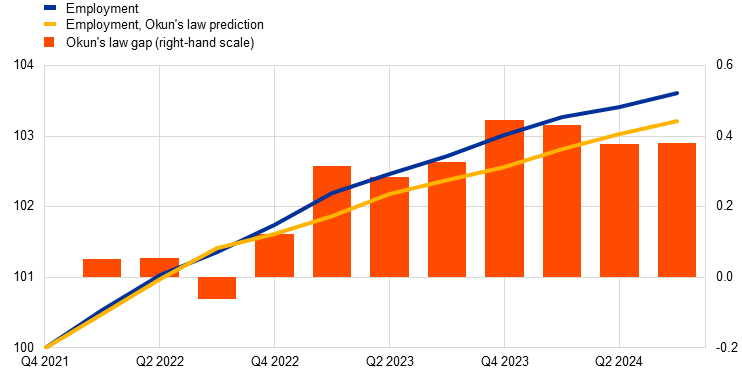
Since the end of the pandemic, growth in employment has significantly exceeded that of economic activity. Historically, based on Okun’s law, employment growth typically expands at approximately half the rate of real GDP growth, with Okun’s elasticities estimated to range between 0.2 and 0.5. Employment growth has, however, surpassed GDP growth since 2022, with elasticities double the conventional estimates (Chart 3, panel a). This phenomenon mirrors the sluggish productivity trends observed within the euro area.
The initial decrease in real wages at the onset of the energy crisis contributed to the disconnect between employment and output growth. The surge in inflation during the recent energy crisis led to a fall in real wages as nominal wages adjusted with a time lag. Initially, moreover, the decline in real wages outpaced the decline in productivity.[6] This gap between real wages and productivity has supported job creation by incentivising firms to hire, or retain, more workers given that labour input was perceived as being less expensive than other inputs (Chart 3, panel b).
Chart 3
Okun’s law, productivity and real wages
a) Okun’s law
(index: Q4 2021 = 100 and percentage points)
b) Productivity and real wages
(index: Q4 2021 = 100)

Sources: Eurostat and ECB calculations.
Notes: The latest observations are for the third quarter of 2024, except for real wages for which they are the second quarter of 2024. In panel a), the red bars show the deviations (in percentage points) from Okun’s law, estimated as an autoregressive distributed lag (1,1) model on the sample for the period from the first quarter of 1995 to the second quarter of 2024, with dummies to take into account the extraordinary dynamics in the second and third quarters of 2020. Panel b) shows real wages deflated both by the private consumption deflator (in yellow) and by the GDP deflator (in dashed red). Productivity is measured as output per employee.
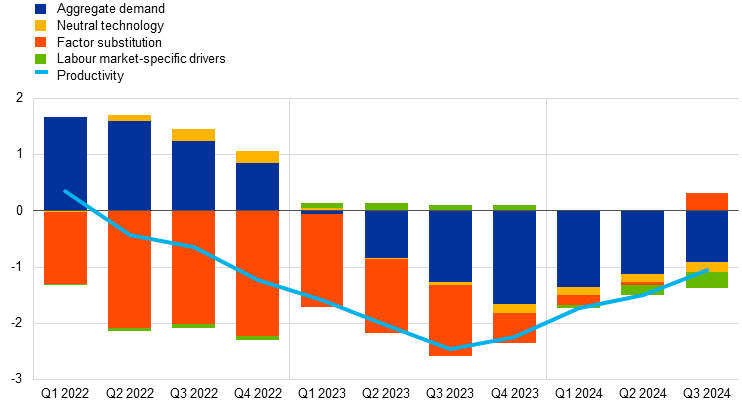
A key factor behind the decoupling of output and employment, leading to negative productivity growth, is the substitution of production factors. An analysis based on a structural Bayesian vector autoregressive model sheds light on the key factors underlying the decoupling of output and employment fluctuations, as well as the procyclicality of labour productivity. The model incorporates a factor substitution shock, capturing the direct substitution of labour with other production inputs, such as intermediate goods, energy and capital.[7] For periods in which there are energy crises and supply chain disruptions, this shock aims to capture the reallocation among inputs following a relative price shock, favouring the cheaper option. When real wages fall compared with other input prices, labour becomes more affordable than energy, capital and intermediate goods, naturally resulting in reallocation and substitution effects. The significance of the factor substitution shock is illustrated by the red bars in Chart 4, showing its substantial impact on productivity growth by driving output down and employment up. Consequently, the model attributes much of the recent productivity decline to cyclical factors. The resilience of the labour market, bolstered by the factor substitution shock, exacerbated this productivity drop. With the dissipation of the factors driving the factor substitution shock, such as the normalisation of energy and intermediate input prices, there has been a modest recovery in productivity.
Chart 4
Historical decomposition of labour productivity
(percentage changes and percentage point contributions)
Source: Box entitled “Drivers of employment growth in the euro area after the pandemic: a model-based perspective”, Economic Bulletin, Issue 4, ECB 2024.
Notes: Productivity is measured as output per employee. The light blue line depicts year-on-year productivity growth in terms of its deviation from the deterministic component. The bars show the percentage point contribution of each shock. The latest observations are for the third quarter of 2024.
Additional drivers sustained employment dynamics amid economic stagnation. Recovering demand supported employment and output growth until early 2023. Since then, weakening demand has led to a sharper slowdown in economic activity compared with employment growth, exacerbating the deviations from Okun’s law (Chart 4, blue bars). A neutral technology shock (Chart 4, yellow bars), indicative of a decline in total factor productivity, exerted a largely negative impact on both output and employment growth, primarily on account of global supply bottlenecks, leaving productivity virtually unaffected. For 2022 the model attributes minimal negative effects to labour market-specific drivers (Chart 4, green bars), such as changes in labour force participation and increased worker bargaining power. These effects were partially reversed in 2023. The catch-up of real wages makes factor substitution less relevant and favours a realignment of employment and output dynamics, as well as a recovery in productivity.
4 The role of profits in labour hoarding in the euro area
Rising profit margins enabled firms to retain their workers for longer than usual, despite falling revenues.[8] Recent ECB estimates show that higher profit margins have improved the ability of firms to hoard labour in the event of an adverse shock to their economic outlook.[9] The decision by firms to hoard labour is rational and consistent with long-term profit maximisation goals. Profit maximising firms choose to favour labour hoarding when the costs of redundancies, re-employment or training exceed the costs of worker retention. Increased labour hoarding occurs only when firms expect a temporary decline in demand for their goods or services. If a permanent fall in demand is anticipated, there is no incentive for firms to retain workers, given that their labour input would not be needed.
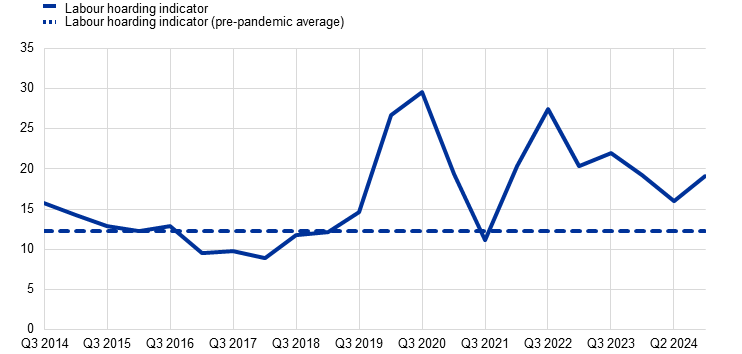
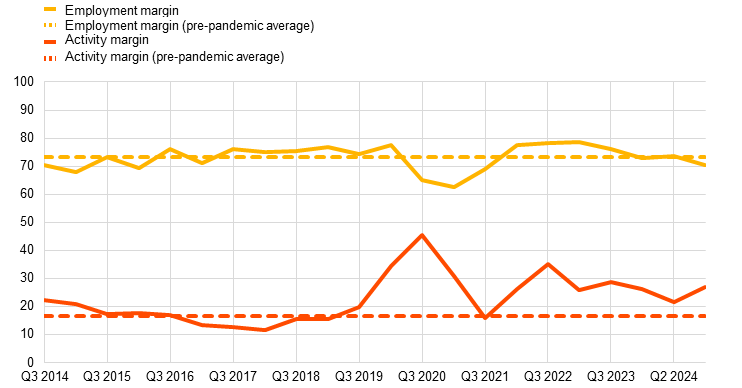
The ECB labour hoarding indicator has remained above the historical average since the first quarter of 2022 but started to weaken in 2024, primarily on account of lower economic activity.[10] The proportion of euro area firms to hoard workers had been relatively flat, at around 12.2%, until the onset of the pandemic, when it sharply increased from 14.7% in the fourth quarter of 2019 to 26.7% in the first quarter of 2020. The indicator has remained elevated since then, albeit showing some cyclical variations including a second sharp increase when energy prices surged. The labour hoarding indicator weakened during the first half of 2024, decreasing from 22% in the third quarter of 2023 to 16% in the second quarter of 2024 (Chart 5, panel a). The indicator for the third quarter of 2024 points to a slight cyclical pick-up in labour hoarding, but to levels significantly lower than those at its peak of 27.4% in the third quarter of 2022. The main driver behind the broad weakening of the labour hoarding indicator is the lower activity margin (Chart 5, panel b). Given that this margin depicts the extent to which adverse shocks affect firms’ outlooks, this suggests that euro area firms are gradually recovering from the energy price shock. In addition, the employment margin, which reflects the ability of firms to retain their workers while contending with these shocks, has been gradually decreasing, suggesting that the buffers that allowed firms to retain their workforce are dissipating. The employment margin of labour hoarding returned to its pre-pandemic level of 73% in the second quarter of 2024, but fell to 70% in the third quarter, 8 percentage points below its peak of 78% in 2022-23. This suggests that firms that are still being affected by negative shocks now have less scope for retaining their workers than in the past, which could be of relevance given that negotiated wages, and consequently labour costs, have been increasing in 2024.[11]
Chart 5
ECB labour hoarding indicator
a) Labour hoarding indicator
(percentage of firms)
b) Activity margin and employment margin
(proportion of firms as a percentage)
Source: Survey on the Access to Finance of Enterprises (SAFE).
Notes: In panel a), the labour hoarding indicator shows the percentage of firms that did not reduce their workforce despite facing a deterioration in their firm’s outlook. In panel b), the activity margin captures the percentage of firms that faced a deterioration in their firm’s outlook over the previous six-month period, while the employment margin refers to the percentage of firms that reported a deterioration in their firm’s outlook but did not reduce their workforce over that same period. Until the end of 2023, the SAFE waves for the first quarter covered the period from October of one year to March of the subsequent year; the waves for the third quarter covered the period from April to September of the same year. Since 2024 onwards, the SAFE waves have been set at a quarterly frequency. The latest observations are for the third quarter of 2024.
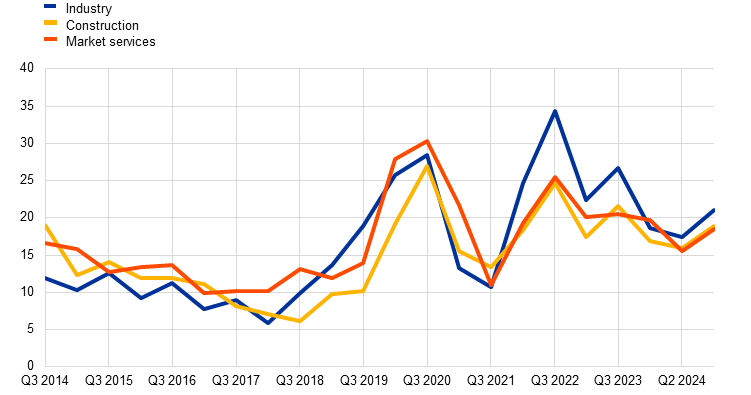
Despite the cyclical increase, the ECB labour hoarding indicator still points to a gradual diminishing of the ability or willingness of firms to retain their workforce, which is broad-based across sectors and particularly strong in market services (Chart 6). The cyclical increase in the labour hoarding indicator in the third quarter of 2024 was common to the industry, construction and market services sectors. This is indicative of an aggregate systemic weakness in the economy that is not being led by any individual sector. While the labour hoarding indicator increased slightly in the third quarter of 2024, the overall trend points to a gradual return to its pre-pandemic levels in all broad sectors of economic activity. In the third quarter of 2024, the labour hoarding indicator also decreased year on year in all sectors, falling by 5.6 percentage points in industry, by 2.7 percentage points in construction and by 2.0 percentage points in the market services sector as compared with the same quarter in 2023. The decline in labour hoarding observed in the market services sector in the third quarter of 2024 was driven both by a lower activity margin (down by 1.2 percentage points as compared with the third quarter of 2023) and by a narrower employment margin (down by 4.3 percentage points). By contrast, the fall in the activity margin in the industry and construction sectors in the third quarter of 2024 (of around 3.5 percentage points for industry and 1.7 percentage points for construction as compared with the same quarter in 2023) was offset by an increase in the employment margin in both sectors, leading to a smaller decrease in the ECB labour hoarding indicator in these sectors than that which the activity margin would otherwise suggest.
Chart 6
ECB labour hoarding indicator by sector of economic activity
(percentage of firms)
Source: Survey on the Access to Finance of Enterprises (SAFE).
Notes: The labour hoarding indicator is the percentage of firms that did not reduce their workforce despite facing a deterioration in their firm’s outlook. Until the end of 2023, the SAFE waves for the first quarter covered the period from October of one year to March of the subsequent year; the waves for the third quarter covered the period from April to September of the same year. The latest observations are for the third quarter of 2024.
It is important to continue to monitor the resilience of firms to adverse shocks and their ability to hoard labour when needed. Euro area firms proved to be highly resilient to the very adverse economic conditions arising from the pandemic-induced lockdowns and the surge in energy prices. The ensuing high profit margins and strong labour hoarding have supported employment growth since the surge in inflation. The expected normalisation of these factors could lead to a gradual deceleration in employment growth over the next few years and may give increasing importance to other channels of adjustment within the euro area labour market, such as changes in labour supply owing to increased workforce participation or cyclical fluctuations in unemployment rates and in labour market transitions from employment into inactivity in the event of a weakness in labour demand.
5 Developments in average hours worked
Average hours worked per employee remained at a relatively lower level following the pandemic, yet helped the labour market to remain resilient in terms of the extensive margin. In the second quarter of 2024, average hours worked were still 1.2% lower than in the fourth quarter of 2019 (Chart 7, panel a), meaning that the average person employed in the euro area worked five hours less per quarter in 2024 compared with before the pandemic. The decline in average hours worked was primarily driven by the public sector and manufacturing (-2.0% and -1.3% respectively), but no sector, other than real estate, has recovered to its pre-pandemic level owing to changes in both labour demand and supply.
Employment growth has remained resilient, despite a slowdown in demand in some sectors and lower average hours worked. Recent evidence provided by the Survey on the Access to Finance of Enterprises and the ECB Corporate Telephone Survey shows that the lower hours worked were, to some extent, also driven by a reduced need for workers. Firms, in particular in the manufacturing sector, reported weaker demand as a key factor for reduced working time. Alongside current demand levels, firms confirmed that labour hoarding was an important factor behind the declining number of hours worked per employee. For firms, the decrease in average hours worked attributable to lower demand therefore had a structural component, owing to difficulties in hiring new workers, but also had a cyclical component that could be expected to disappear as demand rises.
On the labour supply side, lower average hours worked are mainly driven by less overtime and a higher prevalence of persons who did not work in the reference week. Overall, average hours worked in 2022, as measured in the European Union Labour Force Survey, were 0.71 hours per week below their 2019 level.[12] Around one-third of this difference (0.26 hours) was due to a higher proportion of people working zero hours during the reference week compared with before the pandemic (Chart 7, panel b). While this was initially attributable primarily to sick leave during and after the pandemic, more recently, new contract types introduced in France and Spain have increased the frequency of zero hours worked.[13] Another third of the difference (0.23 hours) was driven by a fall in the number of long hours worked (defined as more than 49 hours per week). Although those working long hours are only a very small percentage of the total workforce, they saw a stark reduction in their working time, reflecting a long-term trend. As regards the last third, average hours worked for the remaining population are 0.22 hours below their pre-pandemic level. This means that a significant proportion of the lower average hours worked is due to a rise in the proportion of zero hours worked and a fall in the proportion of long hours worked.
Chart 7
Average hours worked
a) Average hours worked by sector
(index, Q4 2019 = 100)

b) Average hours worked and share of employees working zero or long hours
(weekly hours; percentages)

Sources: Eurostat, National Accounts, European Union Labour Force Survey.
Notes: The latest observations are for the second quarter of 2024 (panel a) and for 2022 (panel b). “Long hours” are the percentage of employees who worked more than 49 hours per week. “Average hours (1-49)” are the average weekly hours of employees who worked between 1-49 hours in the past week.
There would seem to have been little change in employees working time preferences following the pandemic, suggesting that there will be no future increase in the number of hours supplied and that these preferences will continue to act as a drag on average hours worked. In line with the fall in average hours worked, the European Union Labour Force Survey shows that the preference for working fewer hours is on a declining trend which was not affected by the pandemic. In 2023, while full-time workers and persons employed in managerial positions had no desire to work more hours, part-time workers and workers in elementary occupations were looking to work more intensively. Given that the lower hours worked are explained by lower labour demand in certain sectors only, a closure of the gap in hours worked compared with the pre-pandemic level would require an increase in supplied hours worked. However, working time preferences overall suggest only limited support for a rise in average hours worked in the future and therefore limited downward risks for employment growth.
6 Labour force dynamics
The euro area labour force has increased strongly over recent years and remains substantially higher than its pre-pandemic trend, helping firms to address labour shortages. While the pandemic temporarily discouraged participation in the labour market, the labour force participation rate has since recovered and even surpassed its pre-pandemic levels (Chart 8, panel a). That rate decreased by 2.5 percentage points between the fourth quarter of 2019 and the second quarter of 2020. This reflected a fall in the euro area active working age population of 3.8%, with more than 6 million workers temporarily leaving the labour force during the pandemic according to the data from the European Union Labour Force Survey. Thereafter, the labour force quickly recovered. The labour force participation rate returned to its pre-pandemic level in the fourth quarter of 2021 and by July 2024 the labour force was some 8.6 million above the figure in January 2020, standing 5.3% higher than during the pre-pandemic period. This rate equates to an upwards trajectory of 0.2% per year since 2022, compared with 0.1% between 2009 and 2020.[14] The increased availability of workers may have supported the behaviour of firms in terms of hiring the workers they lacked, or expected to lack, during a period of labour shortages, despite the weak economic environment.
Transitions from inactivity to employment were the main driver of employment growth. The widespread support from job retention schemes helped to contain the flow from employment to inactivity during the pandemic, thereby preventing a larger and more permanent decline in the labour force. While the increase in labour market discouragement following the pandemic was temporary, the recovery followed different paths across different countries. Chart 8, panel a) shows that France, Spain and the Netherlands recovered to their pre-pandemic levels in the third quarter of 2021, while Germany and Italy took longer (second quarter of 2022 and first quarter of 2023 respectively). The pandemic also had a strong impact on teleworking possibilities, increasing the participation of the most impacted groups (women, older workers and workers with a tertiary education).
Chart 8
Labour force participation rate
a) Changes in the euro area labour force participation rate since the fourth quarter of 2019 and country contributions
(percentage points)

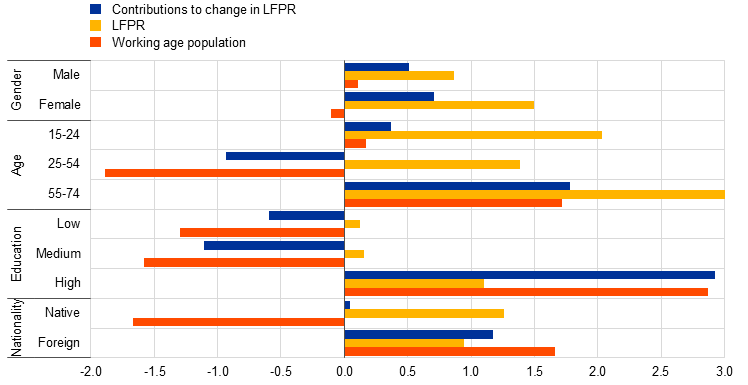
b) Change in labour force participation rate and working age population shares by sociodemographic characteristics between the fourth quarter of 2019 and the second quarter of 2024
(percentage points)
Sources: Eurostat, European Union Labour Force Survey, Integrated Economic and Social Statistics, and authors’ calculations.
Notes: S15 stands for the other 15 countries of the euro area and LFPR stands for labour force participation rate. The latest observations are for the second quarter of 2024.
Compared with the fourth quarter of 2019, the higher labour force participation rate is currently accounted for primarily by women, older workers, workers with a tertiary education and foreign workers (Chart 8, panel b). Across gender groups, men accounted for a 0.5 percentage point increase in the labour force participation rate as compared with its pre-pandemic level, while a 0.7 percentage point rise was attributable to women. As regards age groups, both young and older workers contributed to the higher labour force participation rate, accounting for 0.4 percentage points and 1.8 percentage points respectively, with prime-aged workers having a downward impact on the labour force participation rate, standing at -0.9 percentage points. With regard to educational level (or skills) groups, those with a tertiary education were responsible for most of the increase in the labour force participation rate, seeing a 2.9 percentage point rise. Conversely, those with a lower level of education contributed negatively to the labour force participation rate, with a fall of 0.6 percentage points, as did workers with a secondary education (medium-skilled workers), down by 1.1 percentage points. In terms of nationality, the contribution of native workers to the rise in the labour force participation rate was insignificant, whereas foreign workers contributed by 1.2 percentage points.
Two factors underlie the increase in the labour force participation rate across sociodemographic groups: (i) the increase in each group’s participation rates and (ii) changes in each group’s share in the working age population since the onset of the pandemic. Changes in the composition of the working age population are important for quantifying the contributions of each group to the increase in the labour force participation rate. For example, the ageing of the population can be seen from the sharp reduction in prime-aged workers in the working age population and the strong rise in older workers.[15] While the labour force participation rate for prime-aged workers strengthened between the fourth quarter of 2019 and the second quarter of 2024, the sharp decline of this group in the working age population contributed negatively to the overall increase in the labour force participation rate. The same was true for persons with a secondary education. As regards nationality, there was a rise in the working age population for foreign workers in the euro area and a corresponding reduction in the working age population for native workers. Given that both groups saw labour force participation rate increases, their contributions were still positive, albeit around zero for native workers.
7 Survey-based expectations of employment and unemployment
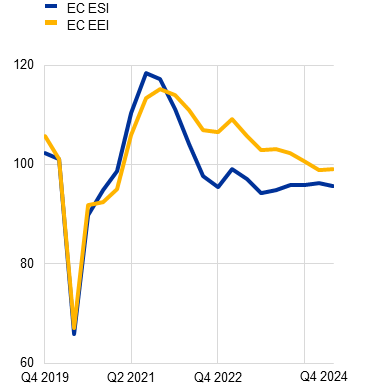
Recent survey results suggest that firms expect employment growth to slow over the near term (Chart 9, panel a). The quarterly Survey on the Access to Finance of Enterprises asks euro area firms about their employment expectations over the coming 12 months. The results of the most recent survey for the third quarter of 2024 suggest that firms were expecting a continued slowdown in their employment growth. Average employment growth expectations in the euro area as indicated by the survey stood at 1% year on year in the third quarter of 2024, down from 1.3% in the second quarter. This is broadly in line with the near-term slowdown in employment growth foreseen in the December 2024 Eurosystem staff macroeconomic projections for the euro area. The European Commission’s survey-based Employment Expectations Indicator, which captures firms’ employment growth expectations for the next three months, also points to muted employment growth expectations. Across sectors, employment growth expectations remain the highest for services and the lowest for the industrial sector. In addition, employment growth expectations have become more aligned with the European Commission’s Economic Sentiment Indicator (Chart 9, panel a), suggesting that productivity growth will improve. While the two indicators co-moved until the end of 2021, from 2022 onwards employment growth expectations remained consistently higher than economic sentiment, reflecting the lower productivity growth observed during that period.
Chart 9
Expectations of firms, households and professional forecasters
|
a) Employment growth expectations and economic sentiment of firms |
b) Unemployment rate expectations of households and professional forecasters |
|---|---|
| (standardised balance indicator) | (percentages) |
 |
 |
Sources: European Commission Consumer and Business surveys, ECB Survey of Professional Forecasters (SPF) and ECB Consumer Expectations Survey (CES).
Notes: EC ESI stands for the European Commission Economic Sentiment Indicator and EC EEI for the European Commission Employment Expectations Indicator. CES expectations are demeaned by the deviation of national unemployment rate perceptions from the euro area average unemployment rate. The latest observations are for the fourth quarter of 2024 for the European Commission data (approximated by October values) (panel a), for the third quarter of 2024 for the CES and for the fourth quarter of 2024 for the SPF data (panel b).
The unemployment rate is expected to remain low over the coming quarters. Following a spike at the outbreak of the pandemic, the unemployment rate expectations of professional forecasters and consumers have fallen steadily. The ECB Survey of Professional Forecasters indicates that the unemployment rate in the euro area is expected to remain stable over the near and long term, and close to its lowest level since the introduction of the euro (Chart 9, panel b). In the latest wave of the survey from the fourth quarter of 2024, the average 12-month ahead forecast stood at 6.5% and the distribution of estimates was roughly balanced around the average. Expectations of the unemployment rate five years ahead were slightly lower, averaging 6.4%. These expectations for the near-term unemployment rate are closely aligned with the average unemployment rate for 2025 of 6.5% foreseen in the December 2024 Eurosystem staff macroeconomic projections for the euro area. They are also broadly in line with the expectations of households elicited from the ECB Consumer Expectations Survey. In the most recent wave of this survey, respondents reported lower unemployment rate expectations than in the previous survey,[16] albeit slightly above those of professional forecasters (Chart 9, panel b).
Overall, survey data suggest a relatively stable labour market looking ahead. Employment growth is expected to moderate, whereas unemployment is expected to remain low. Employment expectations also seem to be aligning more closely with expectations for economic activity, which suggests a recovery in productivity growth going forward. Survey-based expectations would therefore appear to support a cyclical adjustment in the labour market.
8 Concluding remarks
Labour market resilience is an important determinant in assessing future wage and inflation developments. By closely monitoring labour market resilience, policymakers can better predict and manage inflation, ensuring sustainable economic growth and stability. The factors determining labour market resilience affect the response of inflation to economic shocks differently. The current resilience in employment has been driven primarily by the labour hoarding tendencies of firms and by the immediate adjustment of real wages in response to the energy crisis. Much of the recent strength observed in the euro area labour market can therefore be attributed largely to cyclical factors, which are generally expected to dissipate going forward.
Looking ahead, the euro area labour market is expected to return closer to its historical correlation with output, given that it is anticipated that some of the cyclical factors that sustained employment will abate. Energy and intermediate input prices are normalising, albeit at a higher level, while inflation is falling and real wages are rebounding. This will make the substitution between labour and other inputs less relevant. As profits stabilise and demand weakens, the incentive for firms to hoard labour will diminish. Structural factors, such as a negative trend in average hours worked and labour force dynamics, are likely to persist over the medium term. Other structural elements are poised to significantly influence future developments in labour markets. Key among these are the ongoing reallocation of resources and the efforts being made to support a green and digital transition. Furthermore, sociodemographic changes will play a critical role in shaping labour market dynamics.
-
These patterns have also been observed in the United States; see Consolo, A. and Petroulakis, F., “Did COVID-19 induce a reallocation wave?”, Economica, Vol. 91, Issue 364, October 2024, pp. 1349-1390. For the euro area, see the article entitled “Hours worked in the euro area”, Economic Bulletin, Issue 6, ECB, 2021.
-
For a comprehensive review of the concept of labour hoarding, see Biddle, J., “The Cyclical Behavior of Labour Productivity and the Emergence of the Labour Hoarding Concept”, Journal of Economic Perspectives, Vol. 28, No 2, 2014, pp. 197-212.
-
See, for example, the article entitled “The slowdown in euro area productivity in a global context”, Economic Bulletin, Issue 3, ECB, 2017.
-
See also the box entitled “The post-pandemic recovery – why is the euro area growing more slowly than the United States?”, Economic Bulletin, Issue 4, ECB, 2024, and the box entitled “Labour productivity growth in the euro area and the United States: short and long-term developments”, Economic Bulletin, Issue 6, ECB, 2024.
-
It should be noted that there is considerable uncertainty surrounding statistics derived from the UK’s Office for National Statistics Labour Force Survey, see the article entitled “Uncertainties around Labour Force Survey data”, Monetary policy report, Bank of England, May 2024.
-
The fall in real wages in the aftermath of the energy crisis is visible when nominal wages are deflated by the real GDP deflator (appropriate for a comprehensive analysis of economic activity, as done using a Bayesian vector autoregressive model). It is even starker when nominal wages are deflated by the consumption deflator (to reflect changes in the cost of living).
-
The factor substitution shock is a technological shock, which features a negative conditional correlation between output and employment. The substitution of factors captured by this shock can take place at both firm level – with a change in production inputs – or at the sectoral level – with labour-intensive sectors gaining a share relative to other sectors. For a more detailed description of the model, see the box entitled “Drivers of employment growth in the euro area after the pandemic: a model-based perspective”, Economic Bulletin, Issue 4, ECB, 2024.
-
In the recent ECB Corporate Telephone Survey, around one-third of the respondents agreed that recent profitability had made labour hoarding more affordable. See the box entitled “Findings from a survey of leading firms on labour market trends and the adoption of generative AI”, Economic Bulletin, Issue 6, ECB, 2024.
-
See the box entitled “Higher profit margins have helped firms hoard labour”, Economic Bulletin, Issue 4, ECB, 2024. In this article, the increase in profit margins was calculated using firm-level data from the Survey on the Access to Finance of Enterprises and from the Moody’s Orbis dataset on the balance sheets of firms. In this dataset, profit margins are defined as the ratio of a firm’s profits before taxes to its operating revenues. The growth in profit margins using firm-level data for 2021-22 is consistent, albeit not directly comparable, with the increase in unit profits recorded at the macro level using aggregated data from the National Accounts. For the macro indicator of unit profits, see the box entitled “Profit indicators for inflation analysis considering the role of total costs”, Economic Bulletin, Issue 4, ECB, 2024.
-
The ECB labour hoarding indicator measures the proportion of firms that did not reduce their number of employees despite facing a deterioration in their firm’s economic outlook. This indicator is measured using data from the Survey on the Access to Finance of Enterprises. It is defined as the proportion of firms with a deteriorating outlook that did not reduce their number of employees in the current quarter. The labour hoarding indicator can be broken down into two margins: (i) an activity margin that captures the proportion of firms that face a deterioration in their firm’s outlook; and (ii) an employment margin that shows the proportion of firms that reported a deterioration in their outlook but that did not reduce their number of employees.
-
See Bing, M., Holton, S, Koester, G. and Roca I Llevadot, M., “Tracking euro area wages in exceptional times”, The ECB Blog, ECB, 23 May 2024.
-
In the European Union Labour Force Survey, the average of “actual hours worked” during a reference week is the closest measure to the average hours worked as defined in the National Accounts.
-
In France, this is potentially affected by a higher number of apprentices with frequent school-based training periods, and in Spain by new contract types allowing for spells of non-employment to curb the seasonality of spells of employment. Both might have led to more hiring of workers with lower average hours.
-
For an earlier take on this topic, see the box entitled “Labour supply development during the COVID-19 pandemic”, Economic Bulletin, Issue 7, ECB 2021, and Berson, C. and Botelho, B., “Record labour participation: workforce gets older, better educated and more female”, The ECB Blog, ECB, 8 November 2023.
-
For the impact on public spending and potential output growth, see the box entitled “Ageing cost projections – new evidence from the 2024 Ageing Report”, Economic Bulletin, Issue 5, ECB, 2024.
-
This is in line with the unemployment expectations of households, as reported by the European Commission Business and Consumer survey. In the latest survey, households expected the number of unemployed to grow at a rate below its long-term average.
Poslední zprávy z rubriky Makroekonomika:
Přečtěte si také:
Příbuzné stránky
- Kurz Eura, Euro EUR, aktuální kurzy koruny a měn
- Státní svátky 2024
- Kalendář jmen 2024 - svátky
- Prázdniny 2024/2025 nezveřejněny
- Státní svátky Prosinec 2024
- Kalendář jmen Listopad 2024 - svátky
- Kalendář jmen Prosinec 2024 - svátky
- Kalkulačka OSVČ 2024 (za rok 2023) - výpočet daně, sociálního a zdravotního pojištění
- Zvýšení důchodu 2024 - kalkulačka: důchod 18.000 Kč se od června 2023 zvýší o 722 Kč.
- Ošetřovné 2024 - kalkulačka: celkem 6.399 Kč za 9 dnů ošetřovného při příjmu 40.000 Kč. O 27 Kč více než vloni.
- Nemocenská 2024 - kalkulačka: lidé s příjmy nad 41.000 Kč si na nemocenské letos mírně polepší.
- Zálohy OSVČ 2024 - sociální a zdravotní pojištění. Minimální zálohy, splatnost, paušální daň, nemocenské pojištění
Prezentace
21.01.2025 Nejoblíbenější Xiaomi roku má nástupce.
16.01.2025 Nejnadupanější telefon současnosti se začal…
27.12.2024 Stále více lidí investuje do bitcoinu.
Okénko investora

Ali Daylami, BITmarkets

Petr Lajsek, Purple Trading

Jakub Petruška, Zlaťáky.cz
ČNB patří mezi pět největších kupců zlata mezi centrálními bankami

Charu Chanana, Saxo Bank

Mgr. Timur Barotov, BHS
Peněz bude stále více: Investování již není možnost ale nutnost!

Olívia Lacenová, Wonderinterest Trading Ltd.
Překoná zlato v roce 2025 úroveň 3 000 USD? Prognózy se liší, důvody však zůstávají stejné

Miroslav Novák, AKCENTA

Jiří Cimpel, Cimpel & Partneři
Svět se mění: 4 klíčové výzvy, na které musíte připravit své děti


