Euro area international trade in goods surplus €16.4 bn
Euro area
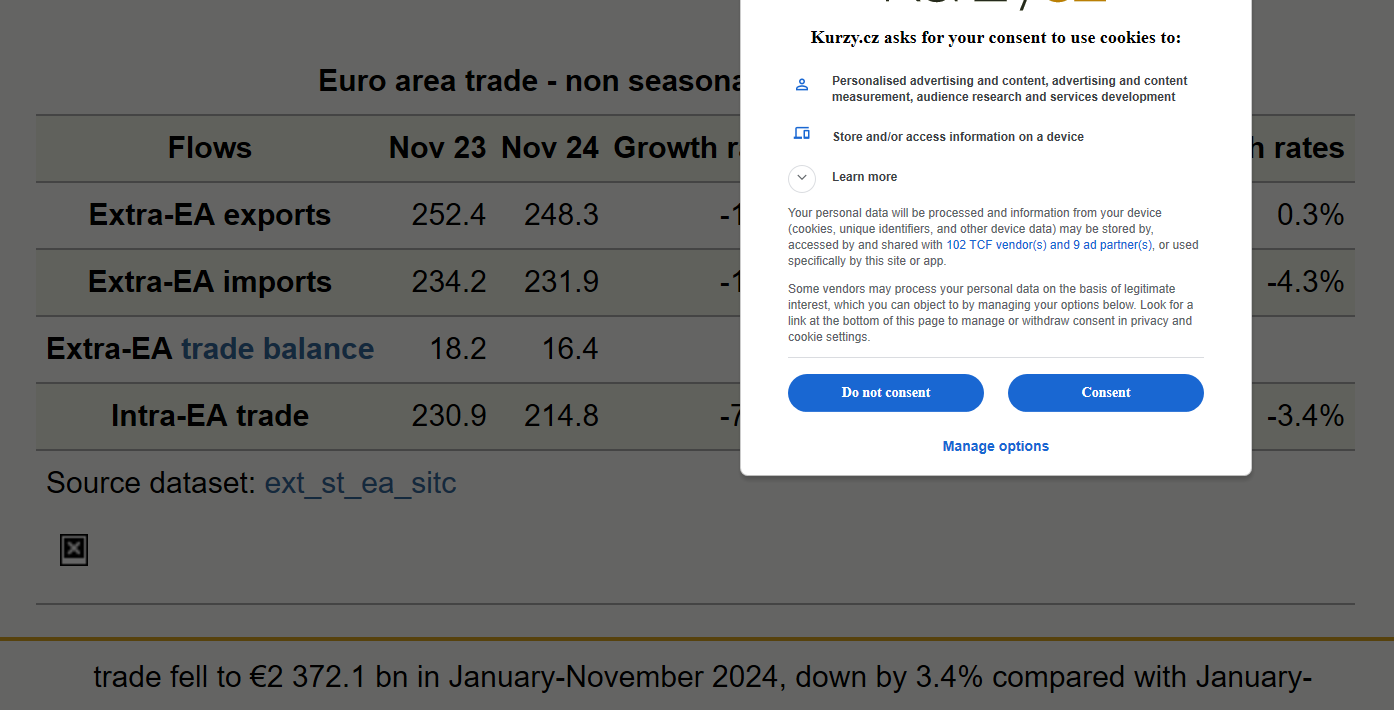
The first estimates of euro area balance showed a €16.4 bn surplus in trade in goods with the rest of the world in November 2024, compared with + €18.2 bn in November 2023.
The euro area exports of goods to the rest of the world in November 2024 were €248.3 billion, a decrease of 1.6% compared with November 2023 (€252.4 bn).
Imports from the rest of the world stood at €231.9 bn, a fall of 1.0% compared with November 2023 (€234.2 bn).

In November 2024 the euro area surplus increased compared to October 2024, from €8.6 bn to €16.4 bn. This increase was mainly due to an increase in the surplus for chemicals and related products (from €+20.7 bn to €+23.4 bn) and a shift in the balance for other manufactured goods (from €-1.2 bn to €+1.9 bn).

In January to November 2024, the euro area recorded a surplus of €161.9 bn, compared with €40.9 bn in January-November 2023.
The euro area exports of goods to the rest of the world rose to €2 636.8 bn (an increase of 0.3% compared with January-November 2023), and imports fell to €2 474.9 bn (a decrease of 4.3% compared with January-November 2023).
Intra-euro area trade fell to €2 372.1 bn in January-November 2024, down by 3.4% compared with January-November 2023.
Euro area trade - non seasonally adjusted data (bn €) |
||||||
|---|---|---|---|---|---|---|
Flows |
Nov 23 |
Nov 24 |
Growth rates |
Jan-Nov 23 |
Jan-Nov 24 |
Growth rates |
Extra-EA exports |
252.4 | 248.3 | -1.6% | 2 628.0 | 2 636.8 | 0.3% |
Extra-EA imports |
234.2 | 231.9 | -1.0% | 2 587.2 | 2 474.9 | -4.3% |
Extra-EA trade balance |
18.2 | 16.4 | 40.9 | 161.9 | ||
Intra-EA trade |
230.9 | 214.8 | -7.0% | 2 455.4 | 2 372.1 | -3.4% |
Source dataset: ext_st_ea_sitc
|
||||||

European Union
The EU balance showed a €14.3 bn surplus in trade in goods with the rest of the world in November 2024, compared with +€17.2 bn in November 2023.
The extra-EU exports of goods in November 2024 was €223.1 billion, down by 1.2% compared with November 2023 (€225.8 bn).
Imports from the rest of the world stood at €208.8 bn, up by 0.1% compared with November 2023 (€208.6 bn).

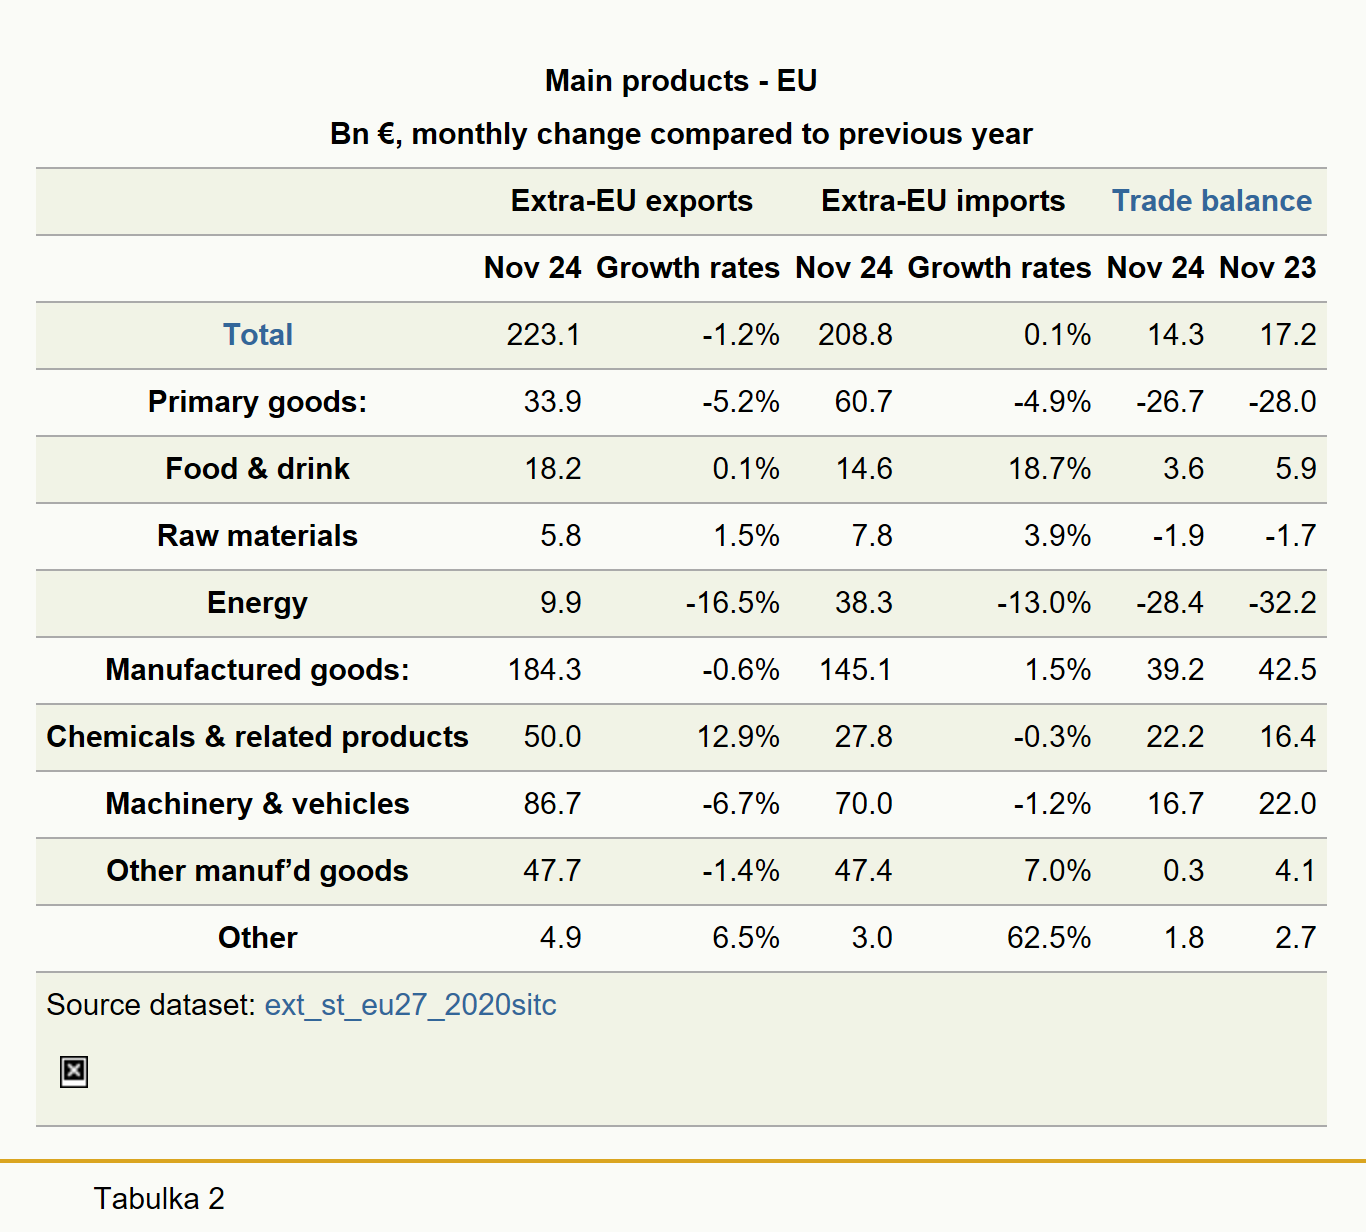
When looking at the breakdown of the EU balance by product, the picture is similar to the graph of the euro area. In November 2024, compared to October 2024, the EU surplus increased from €+5.0 bn to €+14.3 bn.
This increase was mainly driven by an increased surplus in chemicals and related products (from €+19.0 bn to €+22.2 bn) and a shift in the balance for other manufactured goods (from €-3.7 bn to €+0.3 bn).

In January to November 2024, extra-EU exports of goods rose to €2 375.0 bn (an increase of 0.8% compared with January-November 2023), and imports fell to €2 239.2 bn (a decrease of 4.2% compared with January-November 2023).
As a result, the EU recorded a surplus of €135.8 bn, compared with €18.3 bn in January-November 2023.
Intra-EU trade fell to €3 722.2 bn in January-November 2024, -2.6% compared with January-November 2023.
EU trade - non seasonally adjusted data (bn €) |
||||||
|---|---|---|---|---|---|---|
Flows |
Nov 23 |
Nov 24 |
Growth rates |
Jan-Nov 23 |
Jan-Nov 24 |
Growth rates |
Extra-EU exports |
225.8 | 223.1 | -1.2% | 2 355.5 | 2 375.0 | 0.8% |
Extra-EU imports |
208.6 | 208.8 | 0.1% | 2 337.2 | 2 239.2 | -4.2% |
Extra-EU trade balance |
17.2 | 14.3 | 18.3 | 135.8 | ||
Intra-EU trade |
362.1 | 342.5 | -5.4% | 3 821.7 | 3 722.2 | -2.6% |
Source dataset: ext_st_eu27_2020sitc
|
||||||
Main products - EU Bn €, monthly change compared to previous year |
||||||
|---|---|---|---|---|---|---|
Extra-EU exports |
Extra-EU imports |
|||||
Nov 24 |
Growth rates |
Nov 24 |
Growth rates |
Nov 24 |
Nov 23 |
|
| 223.1 | -1.2% | 208.8 | 0.1% | 14.3 | 17.2 | |
Primary goods: |
33.9 | -5.2% | 60.7 | -4.9% | -26.7 | -28.0 |
Food & drink |
18.2 | 0.1% | 14.6 | 18.7% | 3.6 | 5.9 |
Raw materials |
5.8 | 1.5% | 7.8 | 3.9% | -1.9 | -1.7 |
Energy |
9.9 | -16.5% | 38.3 | -13.0% | -28.4 | -32.2 |
Manufactured goods: |
184.3 | -0.6% | 145.1 | 1.5% | 39.2 | 42.5 |
Chemicals & related products |
50.0 | 12.9% | 27.8 | -0.3% | 22.2 | 16.4 |
Machinery & vehicles |
86.7 | -6.7% | 70.0 | -1.2% | 16.7 | 22.0 |
Other manuf’d goods |
47.7 | -1.4% | 47.4 | 7.0% | 0.3 | 4.1 |
Other |
4.9 | 6.5% | 3.0 | 62.5% | 1.8 | 2.7 |
Source dataset: ext_st_eu27_2020sitc |
||||||
Main trading partners - EU Bn €, monthly change compared to previous year |
||||||
|---|---|---|---|---|---|---|
Exports |
Import |
Trade balance |
||||
Nov 24 |
Growth rates |
Nov 24 |
Growth rates |
Nov 24 |
Nov 23 |
|
United States |
46.8 | 1.6% | 28.1 | -6.9% | 18.7 | 15.9 |
China |
16.7 | -12.8% | 45.4 | 2.0% | -28.6 | -25.3 |
United Kingdom |
29.8 | -4.3% | 13.5 | -8.5% | 16.3 | 16.4 |
Switzerland |
17.5 | 1.4% | 12.5 | -1.6% | 5.0 | 4.5 |
Türkiye |
9.9 | 2.5% | 8.1 | -3.2% | 1.8 | 1.3 |
Norway |
5.4 | 1.7% | 7.8 | -14.2% | -2.4 | -3.8 |
Japan |
6.5 | 24.8% | 5.2 | -4.1% | 1.3 | -0.3 |
South Korea |
5.1 | 5.8% | 6.3 | 18.3% | -1.3 | -0.6 |
India |
4.1 | 5.6% | 6.6 | 22.9% | -2.5 | -1.5 |
Brazil |
3.3 | -6.8% | 4.1 | 15.0% | -0.9 | -0.1 |
Source dataset: ext_st_eu27_2020sitc
|
||||||
Annex - Seasonally adjusted data
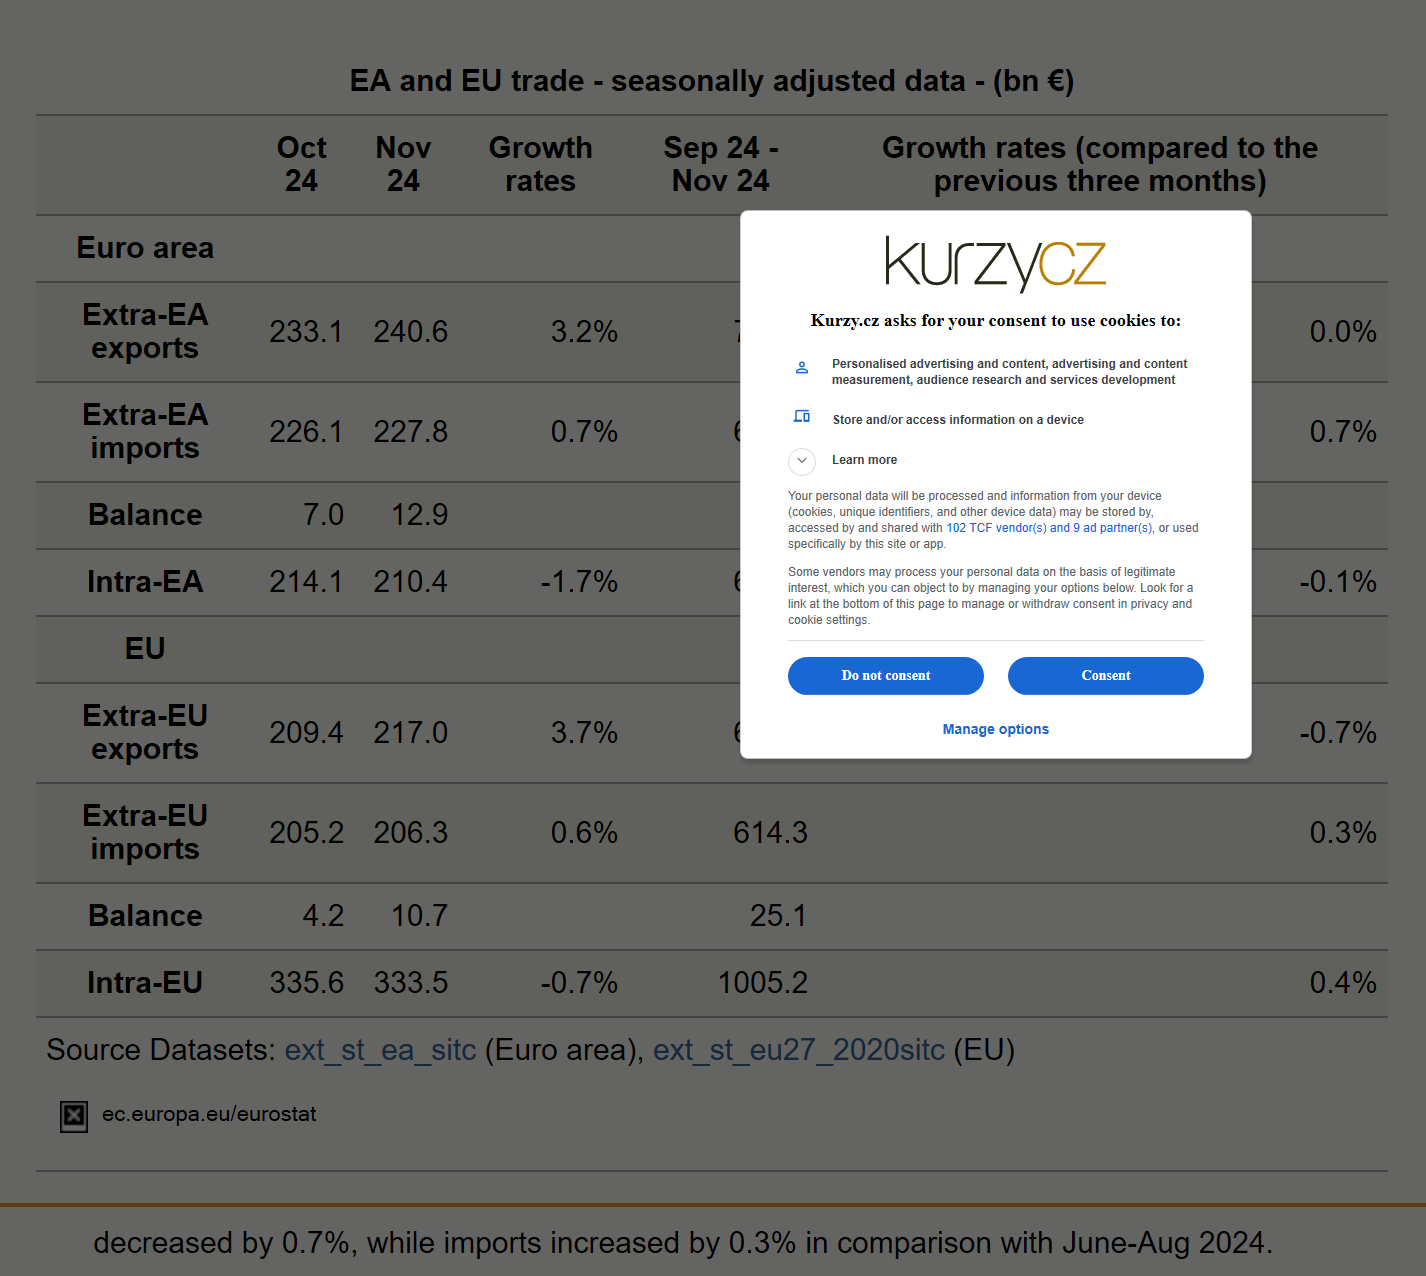
In November 2024 compared with October 2024, seasonally adjusted exports in the euro area increased by 3.2%, while imports rose by 0.7%. As a result, the seasonally adjusted trade balance increased to €12.9 bn, up from €7.0 bn in October 2024.
In November 2024 compared with October 2024, EU seasonally adjusted exports increased by 3.7%, while imports increased by 0.6%. As a result, the seasonally adjusted balance increased to €10.7 bn, up from €4.2 bn in October 2024.
In the last three months, seasonally adjusted exports in the euro area remained stable while imports increased by 0.7%, in comparison with June-Aug 2024. Seasonally adjusted exports in the EU decreased by 0.7%, while imports increased by 0.3% in comparison with June-Aug 2024.
EA and EU trade - seasonally adjusted data - (bn €) |
|||||
|---|---|---|---|---|---|
Oct 24 |
Nov 24 |
Growth rates |
Sep 24 - Nov 24 |
Growth rates (compared to the previous three months) |
|
Euro area |
|||||
Extra-EA exports |
233.1 | 240.6 | 3.2% | 710.4 | 0.0% |
Extra-EA imports |
226.1 | 227.8 | 0.7% | 677.4 | 0.7% |
Balance |
7.0 | 12.9 | 33.0 | ||
Intra-EA |
214.1 | 210.4 | -1.7% | 639.1 | -0.1% |
EU |
|||||
Extra-EU exports |
209.4 | 217.0 | 3.7% | 639.4 | -0.7% |
Extra-EU imports |
205.2 | 206.3 | 0.6% | 614.3 | 0.3% |
Balance |
4.2 | 10.7 | 25.1 | ||
Intra-EU |
335.6 | 333.5 | -0.7% | 1005.2 | 0.4% |
Source Datasets: ext_st_ea_sitc (Euro area), ext_st_eu27_2020sitc (EU)
|
|||||

Notes for users
Revisions and timetable
This News Release is based on information transmitted by Member States to Eurostat before 13 January 2025. Figures are provisional. For more details, see information on data.
Methods and definitions
Statistics on trade in goods are transmitted monthly by the Member States, in accordance with the standard set out in Commission Implementing Regulation (EU) 2020/1197. For each reference month, Member States must compile statistics covering their total extra- and intra-EU trade by using estimates, where necessary. These data are available within 40 days after the end of the reference month, enabling euro area and EU aggregates to be disseminated within around 46 days.
Member States provide Eurostat with raw data, which are adjusted for calendar and seasonal effects by Eurostat. The European aggregates are computed with the indirect approach (by Member States) for total imports and exports, which guarantees additivity between the aggregate and its respective components. The estimation of seasonally adjusted data is based on the Tramo-Seats procedure, which is available in the software JDemetra+.
Data are broken down by broad categories of products as defined by the one-digit codes of the Standard international trade classification (SITC).
Geographical information
The euro area (EA20) includes Belgium, Germany, Estonia, Ireland, Greece, Spain, France, Croatia, Italy, Cyprus, Latvia, Lithuania, Luxembourg, Malta, the Netherlands, Austria, Portugal, Slovenia, Slovakia and Finland.
The European Union (EU27) includes Belgium, Bulgaria, Czechia, Denmark, Germany, Estonia, Ireland, Greece, Spain, France, Croatia, Italy, Cyprus, Latvia, Lithuania, Luxembourg, Hungary, Malta, the Netherlands, Austria, Poland, Portugal, Romania, Slovenia, Slovakia, Finland and Sweden.
For more information
Get in touch
Further information on data
Anton ROODHUIJZEN
Phone: (+352) 4301 35 792
Michele MAROTTA
Phone: (+352) 4301 32 493
E-mail: estat-etfree@ec.europa.eu


