Euro area quarterly balance of payments and international investment position: second quarter of 2024
- STATISTICAL RELEASE
Euro area quarterly balance of payments and international investment position:
second quarter of 2024
04 October 2024
- Current account surplus at €381 billion (2.6% of euro area GDP) in four quarters to second quarter of 2024, after a €76 billion surplus (0.5% of GDP) a year earlier.
- Geographical counterparts: largest bilateral current account surpluses vis-a-vis United Kingdom (€215 billion) and Switzerland (€79 billion) and largest deficits vis-a-vis China (€78 billion) and United States (€18 billion).
- International investment position showed net assets of €1.2 trillion (8.0% of euro area GDP) at end of second quarter of 2024.
Current account
The current account of the euro area recorded a surplus of €381 billion (2.6% of euro area GDP) in the four quarters to the second quarter of 2024, following a €76 billion surplus (0.5% of GDP) a year earlier (Table 1). This development was mainly driven by a larger surplus for goods (from €72 billion to €358 billion) and, to a lesser extent, by widening surpluses for services (from €134 billion to €149 billion) and for primary income (from €34 billion to €37 billion). Moreover, the deficit for secondary income decreased slightly from €164 billion to €163 billion.
The estimates on goods trade broken down by product group show that, in the four quarters to the second quarter of 2024, the increase in the goods surplus was mainly due to a smaller deficit in energy products (from €454 billion to €275 billion). In addition, the surplus for machinery and manufactured products increased from €240 billion to €318 billion, while the balance for other products switched from a €28 billion deficit to a €2 billion surplus.
The higher surplus for services in the four quarters to the second quarter of 2024 was mainly due to larger surpluses for telecommunication, computer and information (from €159 billion to €184 billion) and for travel (from €47 billion to €57 billion), and a lower deficit for other business services (from €54 billion to €42 billion). This was partly offset by a widening deficit for other services (from €55 billion to €75 billion) and a decreasing surplus for transport (from €16 billion to €1 billion).
The increase in the primary income surplus in the four quarters to the second quarter of 2024 was mainly due to larger surpluses in direct investment (from €73 billion to €100 billion) and other primary income (from €5 billion to €14 billion), partly offset by a larger deficit in portfolio equity (from €143 billion to €182 billion).
Table 1
Current account of the euro area
(EUR billions, unless otherwise indicated; transactions during the period; non-working day and non-seasonally adjusted)
Source: ECB.
Notes: “Equity” comprises equity and investment fund shares. Goods by product group is an estimated breakdown using a method based on statistics on international trade in goods. Discrepancies between totals and their components may arise from rounding.
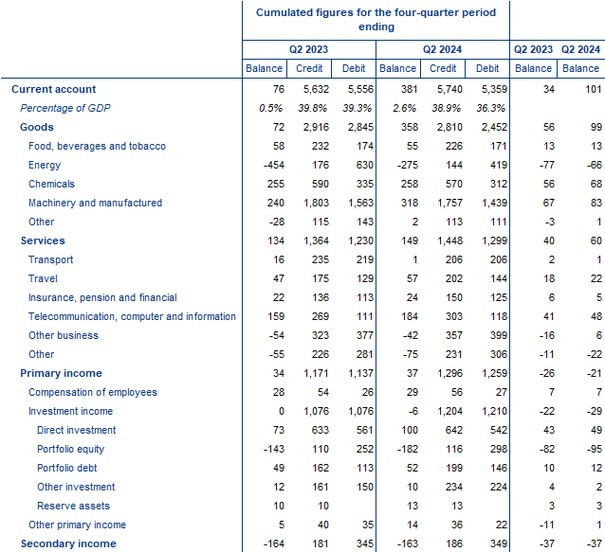
Data on the geographical counterparts of the euro area current account (Chart 1) show that in the four quarters to the second quarter of 2024, the euro area recorded its largest bilateral surpluses vis-a-vis the United Kingdom (€215 billion, up from €184 billion a year earlier) and Switzerland (€79 billion, down from €89 billion). The euro area also recorded a surplus vis-a-vis the residual group of other countries of €96 billion, after a €21 billion deficit a year earlier. The largest bilateral deficits were recorded vis-a-vis China (€78 billion, down from €135 billion a year earlier) and the United States (€18 billion, down from €32 billion).
The most significant changes in the geographical components of the current account relative to the previous year were as follows: the goods deficit vis-a-vis China declined from €166 billion to €105 billion, while the balance vis-a-vis Russia shifted from a deficit (€41 billion) to a surplus (€3 billion). Furthermore, the balance vis-a-vis the residual group of Other countries shifted from a deficit (€104 billion) to a surplus (€39 billion), which was partly explained by a smaller deficit vis-a-vis Norway (from €39 billion to €21 billion) and a shift from a deficit (€6 billion) to a surplus (€5 billion) vis-a-vis Saudi Arabia. The goods surplus increased vis-a-vis the United Kingdom (from €116 billion to €148 billion) and vis-a-vis the United States (from €169 billion to €191 billion). In services, the deficit vis-a-vis the United States increased (from €117 billion to €141 billion), which was more than offset by a shift from a deficit (€15 billion) to a surplus (€18 billion) vis-a-vis Offshore centres. In primary income, the deficit vis-a-vis Offshore centres (€11 billion) turned to a surplus (€21 billion), while a smaller deficit is recorded vis-a-vis the United States (from €82 billion to €67 billion). The deficit in secondary income vis-a-vis the EU Member States and EU institutions outside the euro area decreased (from €77 billion to €71 billion).
Chart 1
Geographical breakdown of the euro area current account balance
(four-quarter moving sums in EUR billions; non-seasonally adjusted)
Source: ECB.
Note: “EU non-EA” comprises the non-euro area EU Member States and those EU institutions and bodies that are considered for statistical purposes as being outside the euro area, such as the European Commission and the European Investment Bank. “Other countries” includes all countries and country groups not shown in the chart, as well as unallocated transactions.
International investment position
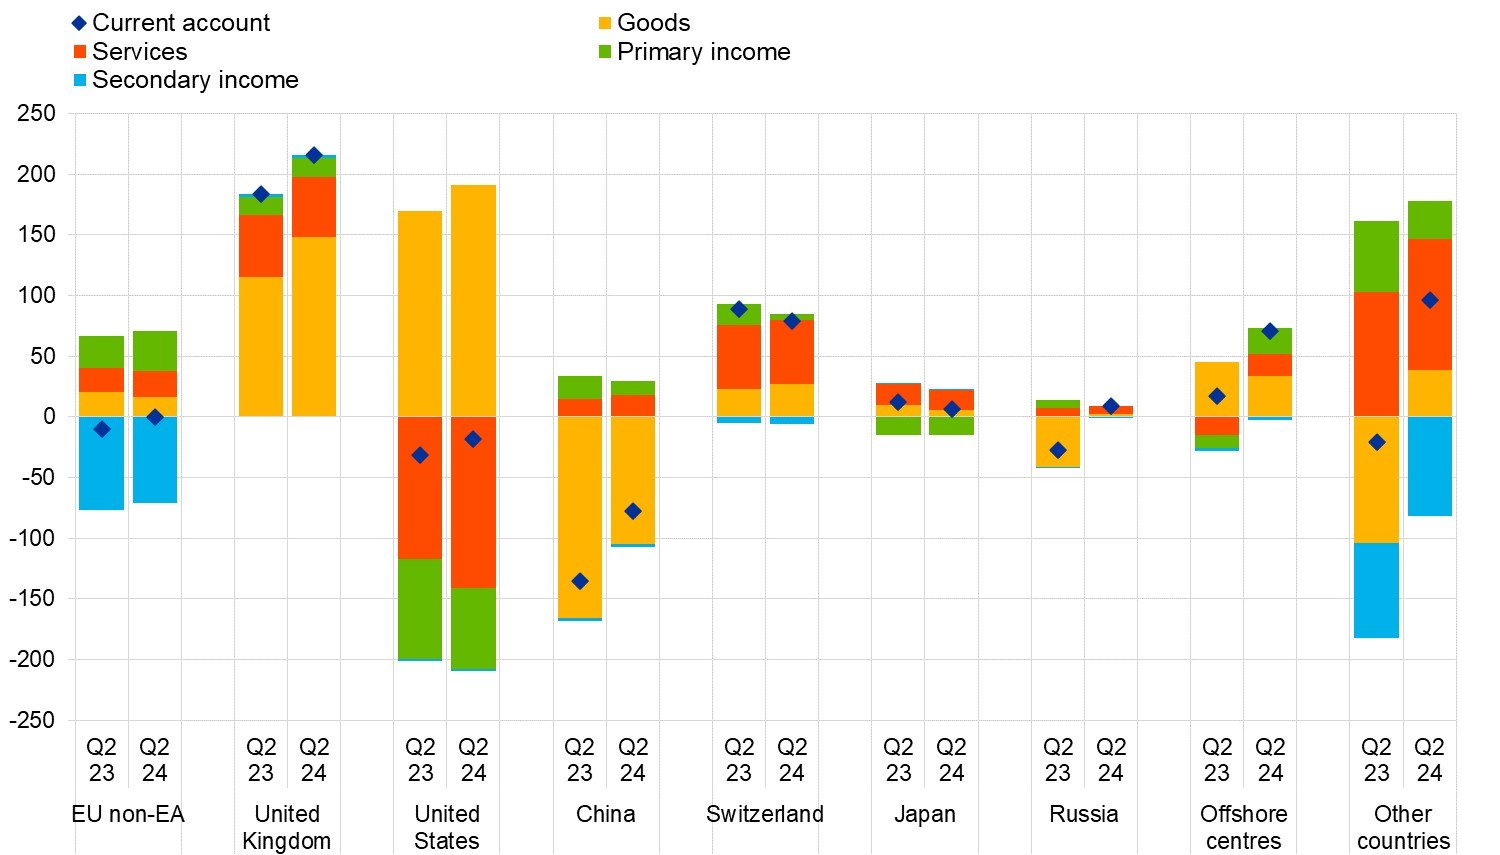
At the end of the second quarter of 2024, the international investment position of the euro area recorded its largest net assets on record, increasing to €1.18 trillion vis-a-vis the rest of the world (8.0% of euro area GDP), up from €0.76 trillion in the previous quarter (Chart 2 and Table 2).
Chart 2
Net international investment position of the euro area
(net amounts outstanding at the end of the period as a percentage of four-quarter moving sums of GDP)
Source: ECB.
The €423 billion increase in net assets was mainly driven by lower net liabilities in other investment (down from €0.76 trillion to €0.63 trillion) and in portfolio equity (from €3.31 trillion to €3.19 trillion), as well as larger net assets in direct investment (up from €2.41 trillion to €2.52 trillion) and in reserve assets (up from €1.22 trillion to €1.27 trillion).
Table 2
International investment position of the euro area
(EUR billions, unless otherwise indicated; amounts outstanding at the end of the period, flows during the period; non-working day and non-seasonally adjusted)
Source: ECB.
Notes: “Equity” comprises equity and investment fund shares. Net financial derivatives are reported under assets. “Other volume changes” mainly reflect reclassifications and data enhancements. Discrepancies between totals and their components may arise from rounding.
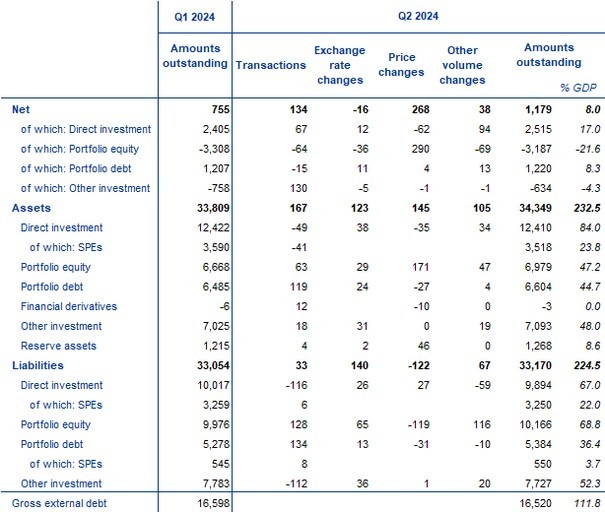
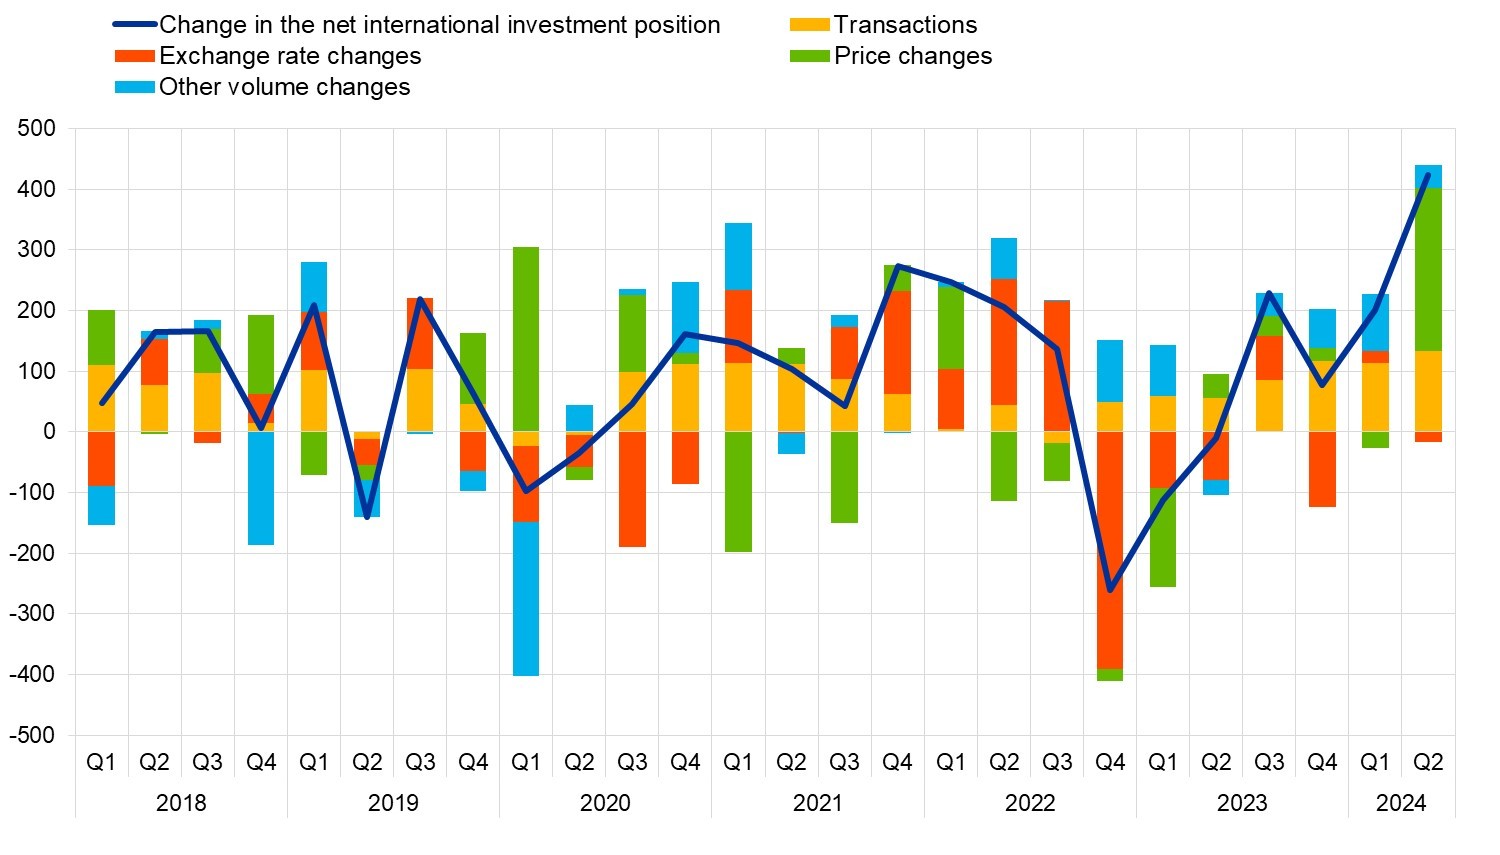
The developments in the euro area’s net international investment position in the second quarter of 2024 were driven mainly by positive price changes, transactions and other volume changes which were slightly offset by negative exchange rate changes (Table 2 and Chart 3). The large positive price changes reflect the divergent evolution of the stock exchange markets in the euro area and outside the euro area.
At the end of the second quarter of 2024, direct investment assets of special purpose entities (SPEs) amounted to €3.52 trillion (28% of total euro area direct investment assets), down from €3.59 trillion at the end of the previous quarter (Table 2). Over the same period, direct investment liabilities of SPEs decreased from €3.26 trillion to €3.25 trillion (33% of total direct investment liabilities).
At the end of the second quarter of 2024 the gross external debt of the euro area amounted to €16.52 trillion (112% of euro area GDP), down by €78 billion compared with the previous quarter.
Chart 3
Changes in the net international investment position of the euro area
(EUR billions; flows during the period; non-working day and non-seasonally adjusted)
Source: ECB.
Note: “Other volume changes” mainly reflect reclassifications and data enhancements.
Data revisions
This statistical release incorporates revisions to the data for the reference periods between the first quarter of 2020 and the first quarter of 2024. The revisions reflect revised national contributions to the euro area aggregates as a result of the incorporation of newly available information, including from major regular revisions.
Next releases
- Monthly balance of payments: 18 October 2024 (reference data up to August 2024)
- Quarterly balance of payments and international investment position: 13 January 2025 (reference data up to the third quarter of 2024)[1]
For queries, please use the Statistical information request form.
Notes
- Data are neither seasonally nor working day-adjusted. Ratios to GDP (including in the charts) refer to four-quarter sums of non-seasonally and non-working day-adjusted GDP figures.
- Hyperlinks in this press release lead to data that may change with subsequent releases as a result of revisions.
-
On 29 October 2024 there will be a second release of the quarterly balance of payments and international investment position data (reference data up to the second quarter of 2024) with revisions to data for periods since at least the first quarter of 2013. This second release will not include a press or statistical release and is aimed at ensuring consistency between the balance of payments/international investment position and the euro area sector accounts and incorporating the benchmark revision exercise performed every five years.
Poslední zprávy z rubriky Makroekonomika:
Přečtěte si také:


Prezentace
02.10.2024 Inflace nezmizí. I 2,2 % vás v čase může…
26.09.2024 Technologický gigant Intel na kolenou! Co…
24.09.2024 XTB představuje Zlatana Ibrahimoviće jako…
Okénko investora

Ali Daylami, BITmarkets
Trump vs. Harris: komu majitelé kryptoměn coby voliči dají radši hlas?

Radoslav Jusko, Ronda Invest

Petr Lajsek, Purple Trading

Mgr. Timur Barotov, BHS

Miroslav Novák, AKCENTA
Utlumená aktivita v tuzemském výrobním sektoru pokračuje – PMI (září 2024)

Olívia Lacenová, Wonderinterest Trading Ltd.
Ocelářská krize v Číně: Ceny železné rudy čelí prudkému oslabení

Jakub Petruška, Zlaťáky.cz

Jiří Cimpel, Cimpel & Partneři

