A historical perspective of monetary policy cycles (Delivering a soft landing)
- THE ECB BLOG
Delivering a soft landing: a historical perspective of monetary policy cycles
24 September 2022
By Ema Ivanova[1], Thomas McGregor, Stefano Nardelli[2] and Annukka Ristiniemi
The views expressed in each blog entry are those of the author(s) and do not necessarily represent the views of the European Central Bank and the Eurosystem.
The job of central banks is to help the economy navigate shocks and steer inflation back to target. This ECB Blog post asks what we can learn from past monetary policy cycles about how to control inflation while achieving a soft landing of the economy.
The economy is a bit like an aeroplane, and central banks are a bit like its pilots. They adjust their policy instruments to navigate their economies through turbulence, shocks and crises, aiming to land smoothly at their destination – price stability. When inflation is too high, central banks increase interest rates to slow the economy and bring inflation back down. Just as pilots calculate their approach and begin the descent to their final destination, policymakers need to judge when to begin easing policy rates to achieve their inflation target and deliver a soft landing for the economy. And just like actual pilots, they can learn from previous experiences to improve how they respond to tough conditions and improve the chances of delivering a soft landing.
This is precisely what we have done, looking back at a total of 48 monetary policy cycles in nine different economies over a period of 50 years (an average of five cycles per country).[3] Out of these 48 “flights” about one third ended in soft landings, that is to say that inflation returned to target within two years without the economy dipping into a recession. So, what factors determine the roughness of the flight and how smoothly the aeroplane touches down on the runway?
The typical monetary policy cycle
Monetary policy cycles are episodes in which policy rates rise quickly from a minimum, or stable, level to reach a local maximum, before either being held at this level or declining again to a new minimum. Across our sample, central banks have tended to increase policy rates by around 20 basis points per month before holding rates at their cruising altitude for eight months and then cutting them by 38 basis points per month during the descent. At the start of the tightening cycles, inflation averaged 2.8%, GDP growth 5.9% and unemployment 6.6%. By the time of the first rate cut, inflation was, on average, even higher at 4.1%, while growth declined markedly, on average, to 2.8% (Table 1). This highlights an important take-away from our analysis: central banks have tended to begin easing the policy stance with inflation still relatively high, possibly driven by concerns about declining growth and financial stability risks. It turns out that successful policy cycles tend to be characterised by declining growth around the time of the first rate cut, followed by a strong economic recovery and declining inflation over the subsequent two years (Chart 1). In soft landing episodes, this growth slowdown paves the way for declining inflation. Hard landings, on the other hand, are characterised by rate cuts in the face of deep recessions, with almost no difference in inflation outcomes compared to soft landings.
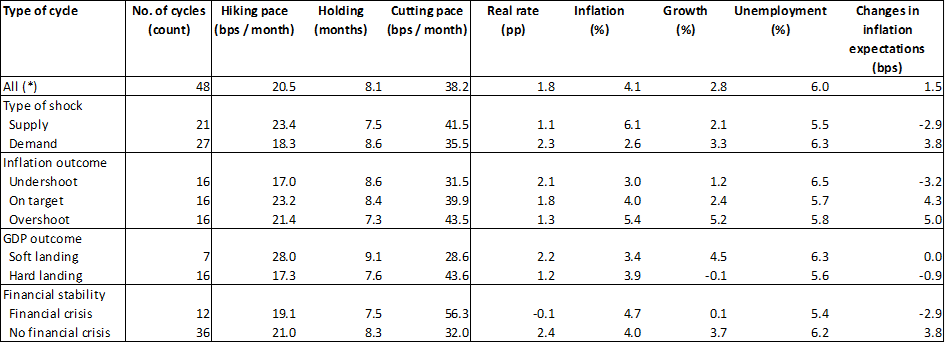
Table 1
Average macroeconomic conditions at the time of the first rate cut across monetary policy cycles of major central banks
Sources: ECB staff calculations
Latest observation: April 2024
Notes: The table shows the average number and pace of rate hikes and cuts across different episodes, as well as the average holding periods. It also shows the average real interest rate (policy rate – inflation), inflation, GDP growth, and unemployment at the start of the easing phase (first rate cut), as well as changes in long term inflation expectations from Consensus Economics between the start of the hiking cycle and the first rate cut. Inflation, GDP growth and unemployment are shown in year-on-year percentage changes, while changes in inflation expectations are shown in basis points.
* The full sample includes all 48 monetary policy cycles across nine central banks since 1970.
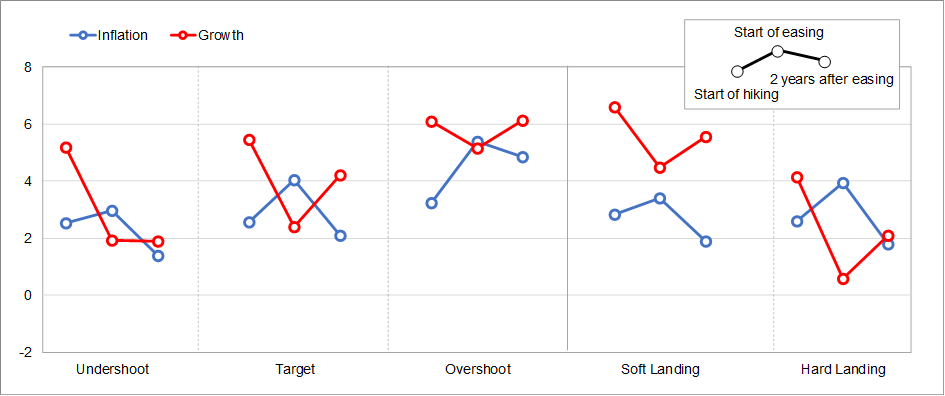
Chart 1
Inflation and growth over the policy cycle
(year-on-year percentage change based on monthly data)
Sources: ECB staff calculations
Latest observation: April 2024
Notes: The charts show the average inflation and growth rates at three points in time across policy cycles: (i) that start of tightening, (ii) the start of easing, and (iii) two years after the start of easing. The chart distinguished between episodes in which inflation undershot the target, landing on target, or overshot the target two years after the start of easing, as well as between soft and hard landing episode, which are labelled on the horizontal axis.
Shocks and crises: unsuccessful cycles
Not all cycles were successful in bringing inflation back down to target. We define successful cycles as those in which inflation returns to target within two years of the start of the first rate cut. Based on this classification, central banks were successful in just under a third of cases, while in the remaining cases inflation either remained significantly above target two years after the start of policy easing or ended up undershooting the target.
Supply shocks, such as the sudden oil price spikes of the 1970s, were among the most likely factors to cause monetary policy cycles to fail. In the face of supply shocks, central bankers hiked interest rates more quickly (23 basis points per month) than in other episodes. But they have also been forced to cut interest rates faster (42 basis points per month) and by more (510 basis points of cuts) as the economic costs mounted and the financial sector came under strain. Over 70% of supply shock cycles in our sample ended in either a recession or a financial crisis. As a result, policy rates fell substantially below their starting levels during these cycles. The average holding period has also been shorter, at around 7.5 months. The challenging macroeconomic environment created by supply shocks is reflected in the data. At the time of the first rate cut inflation typically averaged around 6.1% with growth around 2.1% and unemployment at 5.5%.
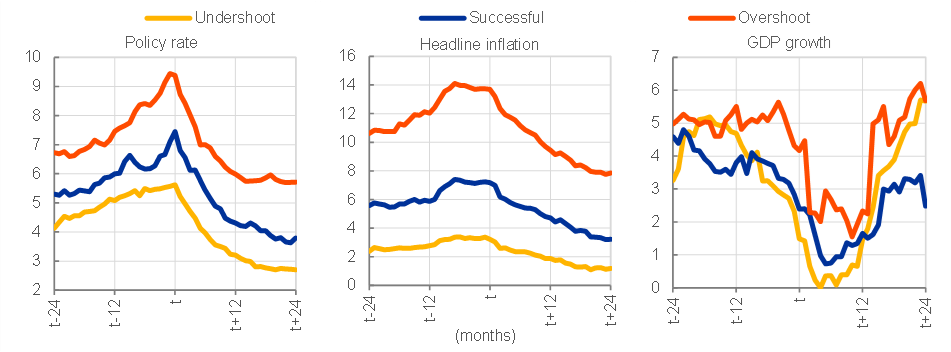
There are three factors that generally differentiate successful policy cycles from unsuccessful ones (Chart 2). First, better inflation outcomes are correlated with more favourable starting conditions such as lower inflation and higher economic growth. Second, growth tends to be lower, both over the tightening and easing phases, in successful episodes compared to unsuccessful ones. And third, unsuccessful cycles are typically characterised by low, if not negative, real rates where inflation is higher than the interest rates. It is worth noting that four of the cycles in our sample ended with the start of the COVID-19 pandemic, which explains, for example, the steep decline in GDP growth soon after the first rate cut at time t=0.
Chart 2
Comparing successful easing cycles with inflation undershoots and overshoots
(percentage points for the policy rates, year-on-year percentage change for inflation and growth based on monthly data)
Sources: ECB staff calculations
Latest observation: April 2024
Notes: The charts show the evolution of policy rates, inflation, and GDP growth over successful, and unsuccessful cycles and in case of inflation undershoots. Successful episodes as defined as those that saw a return of inflation to target within 2 years of the start of the easing phase. Undershoots are defined as those episodes which saw inflation fall below the target, and finally, unsuccessful episodes are defined as those that saw inflation remain structurally above target. The horizontal axis shows the months since the start of the easing cycle (t=0 at first rate cut). GDP growth is converted to monthly by using the quarterly values for the month.
Landing softly: successful cycles
Soft landings are rare and are often easier to deliver in theory than in practice. So why are soft landings so hard to pull off? They require a careful balancing act between two forces that pull in opposite directions: slowing down the economy just enough to bring inflation back down to target, without going too far and triggering a recession. This balance is easier to get right in conducive macroeconomic conditions.
This is reflected in the data. Almost all soft landings are associated with demand shocks, which suggests that supply shocks are more difficult to navigate. They are also characterised by longer holding periods, of around nine months on average, a slower pace of rate cuts, of 29 basis points per month, and higher real interest rates at the time of the first cut compared to the episodes of hard landings. This suggests that sharp policy adjustments are less likely to be successful than cycles in which adjustments are made more gradually.
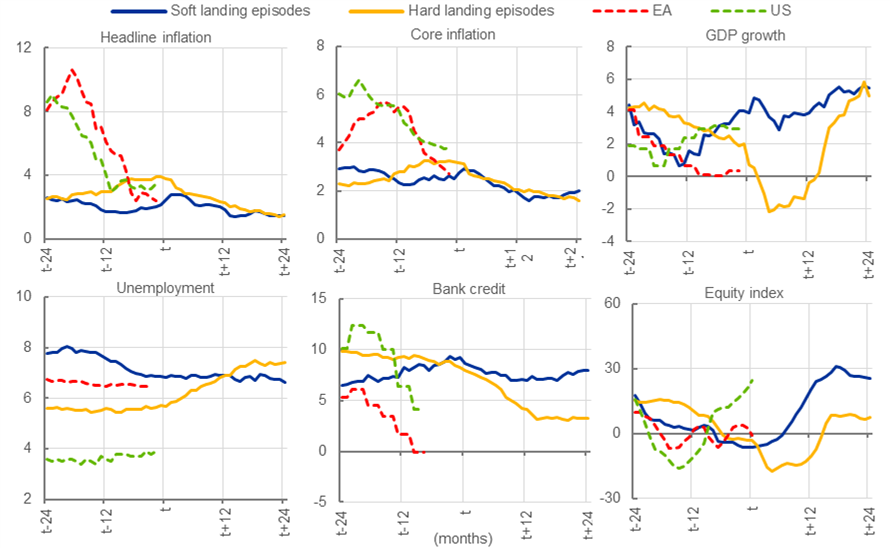
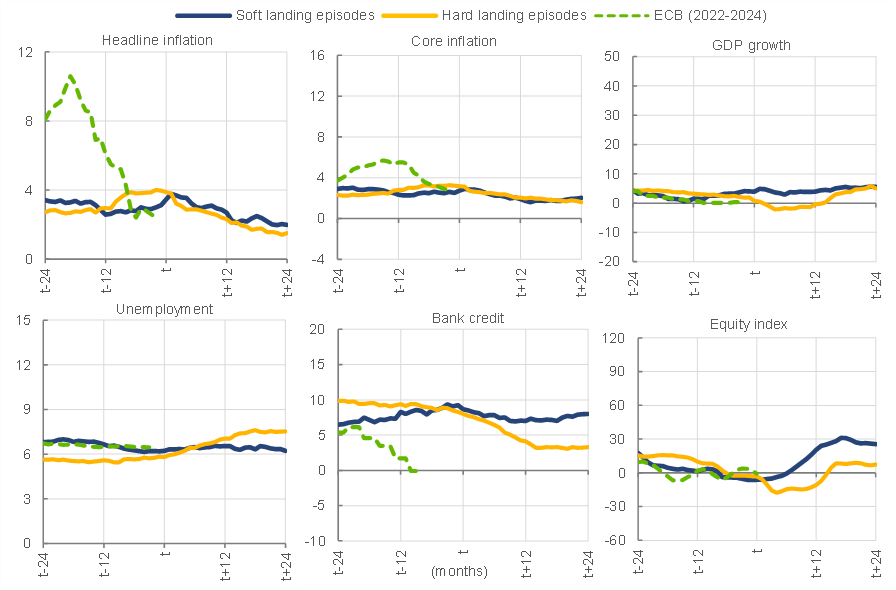
Soft landings typically occur when the inflation peak is lower, particularly in the case of core inflation (headline inflation excluding volatile components such as food and energy). Other factors include unemployment rising only modestly, stock market losses remaining limited, and inflation expectations staying well anchored (Chart 3). Hard landings, on the other hand, often go hand in hand with a financial crisis, a prolonged slowdown in lending to firms and households, and high unemployment, even when rates are cut aggressively. These cuts also typically produce no meaningful difference in inflation outcomes.
Chart 3
Key macroeconomic indicators across successful easing cycles
(year-on-year percentage change for inflation, growth and credit; percent for unemployment; year-on-year percentage change in the 3-month moving average for equity prices)
Sources: ECB staff calculations
Latest observation: April 2024
Notes: The charts show the evolution of key macroeconomic variables over hard and soft landing episodes, as well as for the current ECB rate cycle of 2022-2004 (“EA”). Soft landings are defined as episodes that saw inflation return to target (successful episode) without a recession within 2 years. Hard landings are episodes that saw either: (i) an inflation undershoot or, (ii) inflation successfully returning to target but with a recession or a financial crisis occurring within 2 years. The green lines indicate the current cycle of the ECB. The shaded areas show the min/max range for each variable. The horizontal axis shows the months since the start of the easing cycle (t=0 at first rate cut).
The behaviour of inflation expectations is another distinguishing factor between hard and soft landings. If central banks are credible, then inflation expectations should remain well anchored throughout the monetary policy cycle. It turns out that, in hard landings, long-term inflation expectations decline between the start of the tightening phase and the start of the easing phase. This likely reflects the fact that central banks are often forced into easing by adverse shocks or a rapidly slowing economy. This is not the case for soft landings, where expectations tend to remain remarkably stable throughout the cycle.[4]
What does this mean for the current cycle?
Just as pilots have to monitor atmospheric conditions along their flight path, central banks need to assess the trajectory of inflation, and the prevailing macroeconomic conditions, adjusting their instruments to ensure that inflation returns to target in a timely manner while minimising damage to the economy. As past monetary policy cycles have shown us, supply shocks are a key challenge because they make it more difficult to fight inflation while delivering a soft landing. Central banks have typically hiked aggressively in response to supply shocks. Rates were also cut earlier in the inflationary phases, and more quickly, possibly in response to a weakening growth outlook and declining inflation expectations. These past responses did not lead to soft landings in the past.
Today, the ECB faces a unique set of challenges. Headline inflation surged to a record high of 10.6% in October 2022, driven by a combination of supply shocks, the reopening dynamics following the pandemic, adverse geopolitical factors and structural shifts. In response, the ECB raised policy rates by 450 basis points over 15 months and held them there for nine months before cutting for the first time in June 2024. As a result, inflation has declined rapidly and latest projections see inflation returning to the 2% target in the second half of 2025. And while the economy stagnated between the second half of 2022 and the end of 2023, growth has resumed in the first half of this year. In addition, unemployment is close to historic lows and, while financial stability risks remain contained, geopolitical tensions are a significant source of risk. These are all positive signs, indicating that a hard landing will be avoided in the current cycle unless renewed adverse shocks hit the economy.
Check out The ECB Blog and subscribe for future posts.
For topics relating to banking supervision, why not have a look at The Supervision Blog?
-
Ema Ivanova is currently at the European University Institute in Florence.
-
Stefano Nardelli is a Principal Economist in the ECB’s Directorate General Monetary Policy.
-
Our sample consists of the US Federal Reserve (from 1970), German Bundesbank (from 1970 till 1998), ECB (from 1999), Bank of England (from 1992), Bank of Canada (from 1970), Riksbank in Sweden (from 1993), Norges Bank in Norway (from 2000), Reserve Bank of Australia (from 1993), Reserve Bank of New Zealand (from 1989), and Bank of Japan (from 1970).
-
The earliest observations for long term inflation expectations are from April 1990 and those statistics are not available for Australia and New Zealand.
Related topics
Disclaimer
Please note that related topic tags are currently available for selected content only.
Poslední zprávy z rubriky Makroekonomika:
Přečtěte si také:

Příbuzné stránky
- Philip R. Lane: Monetary policy in Europe: The Role of Monetary Union
- Monetary base (National monetary statistics) - ekonomika ČNB
- Status of your application - Ministry of the interior of the Czech Republic
- Circuits of Value - aktuální a historické ceny kryptoměny Circuits of Value, graf vývoje ceny kryptoměny Circuits of Value - 1 den - měna USD
- Coronavirus - Information of MoI - Ministry of the interior of the Czech Republic
- Internet of Things - aktuální a historické ceny kryptoměny Internet of Things, graf vývoje ceny kryptoměny Internet of Things - 3 dny - měna USD
- Suspension of proceedings - Ministry of the interior of the Czech Republic
- Internet of Things - aktuální a historické ceny kryptoměny Internet of Things, graf vývoje ceny kryptoměny Internet of Things - 3 měsíce - měna USD
- Circuits of Value - aktuální a historické ceny kryptoměny Circuits of Value, graf vývoje ceny kryptoměny Circuits of Value - 3 měsíce - měna USD
- Internet of People - aktuální a historické ceny kryptoměny Internet of People, graf vývoje ceny kryptoměny Internet of People - 2 dny - měna USD
- Circuits of Value - aktuální a historické ceny kryptoměny Circuits of Value, graf vývoje ceny kryptoměny Circuits of Value - 5 dnů - měna USD
- Internet of Things - aktuální a historické ceny kryptoměny Internet of Things, graf vývoje ceny kryptoměny Internet of Things - 1 den - měna USD

Prezentace
27.12.2024 Stále více lidí investuje do bitcoinu.
18.12.2024 Apple iPad je rekordně levný, vyjde teď jen na 8
Okénko investora

Radoslav Jusko, Ronda Invest
AI, demografie a ženy investorky. Investiční trendy pro rok 2025

Miroslav Novák, AKCENTA
ČNB v prosinci přerušila, nikoliv však zastavila cyklus uvolňování měnové politiky

Petr Lajsek, Purple Trading

John J. Hardy, Saxo Bank
Šokující předpověď - Nvidia dosáhne dvojnásobku hodnoty Applu

Olívia Lacenová, Wonderinterest Trading Ltd.

Mgr. Timur Barotov, BHS

Ali Daylami, BITmarkets

Jakub Petruška, Zlaťáky.cz
S návratem Donalda Trumpa zlato prudce klesá. Trhy zachvátila pozitivní nálada

Jiří Cimpel, Cimpel & Partneři
Portfolio 60/40: Nadčasová strategie pro dlouhodobé investory

