Exploring an uncertain future with the help of scenarios
- THE ECB BLOG
Exploring an uncertain future with the help of scenarios
15 January 2025
By Matteo Ciccarelli, Matthieu Darracq Paries, Bettina Landau and Joao Sousa
Central banks project future developments based on past data patterns and a set of assumptions. Crises can change economic structures, complicating this forecasting. The ECB Blog explains how scenario, risk and sensitivity analyses address the new uncertainty.
We use economic models and data patterns from the past to project the future. In normal times, assessing what conditions will be like in the near future can be a relatively “straightforward” task. When inflation and growth are stable and predictable our central forecast, or baseline projection, proves to be reliable. However, recent crises might have caused structural changes, which would introduce analytical uncertainty, in addition to the increased general uncertainty surrounding projections. In response, the ECB has been upgrading the tools and analyses we use in our staff macroeconomic projections, which form an integral part of our economic forecasting. One of these, scenario analysis, is particularly important in the light of a world of increasing uncertainty and change.
So, what do we mean by scenario analysis?
We use three types of additional checks to enhance our standard baseline forecasting: sensitivity analysis, risk analysis, and scenario analysis. All of them, just like our standard forecast, are a combination of two elements: the use of models and expert judgement. The three additional checks in particular aim to show possible deviations from the “normal”, or most likely, forecast. In this sense they complement our baseline projection with “what if” assessments.
First, the sensitivity analysis focuses on how changes in individual factors, such as a huge change in energy prices or a different exchange rate path, might affect economic variables like economic activity and inflation. By altering one variable at a time, models can evaluate the potential impact of uncertain assumptions on the baseline.
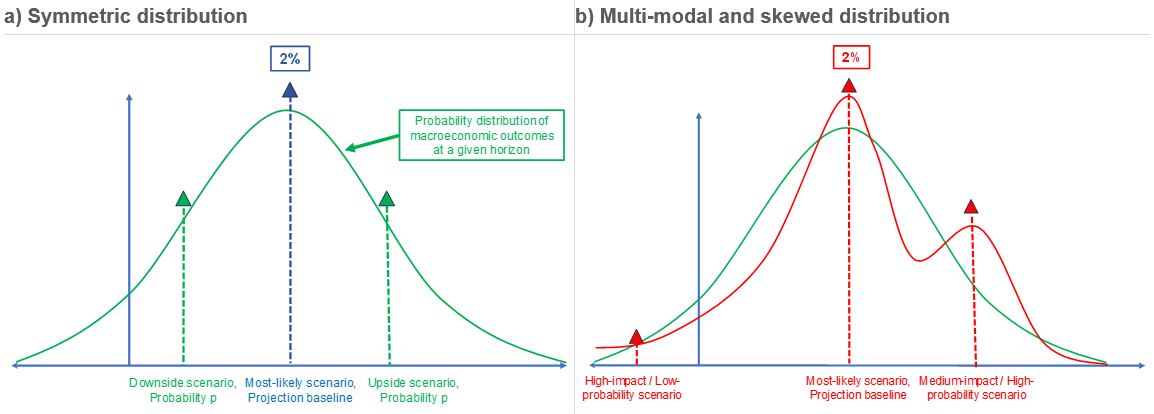
Second, risk analysis looks at how likely it is that economic developments will deviate from the baseline. In theory, the baseline projection would correspond to the mode (i.e. the most-likely outcome) of a “predictive distribution”, while events further away from the mode are less likely to occur. The probability distribution may also show asymmetry to the “right” or to the “left” (see Figure 1), depending on the balance of risks. This asymmetry – which may depend on various quantifiable or only qualitative risk factors – represents the risk balance around the projection. The risk balance helps to interpret projections and decide about monetary policy in periods of heightened uncertainty. The risk analysis tells us to which side deviations from the baseline are more likely. This risk distribution can be estimated by resorting to various models and tools.
Chart 1
Two probability distributions around the same 2% inflation baseline

Sources: Using an analogy to the literature on numerical regarding gaussian quadrature, see Miller, A.C. and T. Rice, (1983), “Discrete Approximations of Probability Distributions”, Management Science, Vol. 29, No. 3.
Finally, the scenario analysis addresses the even more complex “what if” questions. Specifically, it examines the consequences of hypothetical events or economic conditions that deviate from the baseline. For the sensitivity analysis we alter individual factors, while for the scenario analysis the approach is wider and more holistic. The spectrum ranges from major economic and political events – like wars, financial crises, or global energy shocks – to more specific situations like trade tariffs or housing market adjustments, which can affect several factors at the same time.
A typical scenario combines two broad sets of changes from the baseline: i) additional shocks over the projection horizon, and ii) changing features of the macroeconomic propagation mechanism. The shocks driving the scenarios can come from many different directions.
They may stem from the international environment of the euro area – for example through commodity prices, exchange rates or global trade. Or they can be driven by domestic economic conditions – such as financing conditions, household spending, or firms’ price-setting. Another driver might be supply-side fundamentals of the euro area economy – for example increases in productivity related to artificial intelligence.
In addition to the type and magnitude of a shock, scenarios may also think through different future developments by altering how the economy reacts to the shocks. For instance, wages and prices can adjust more quickly to a surge in the cost of energy than to small changes. Or households may save more during times of high uncertainty, or the financial sector could amplify a shock if credit constraints arise. Altogether, a scenario is a blend of various factors which evaluates the impact of economic events on the projection baseline.
How do scenarios relate to a forecast distribution and risk analysis? The economic literature shows that you can reasonably approximate the forecast distributions by resorting to a small number of scenarios (see Figure 1). For instance, a symmetric forecast distribution can be represented by one downside and one upside scenario with equal probabilities. More complex distributions may require multiple scenarios to capture high-impact, low-probability events, or secondary modes of the distribution as shown in Figure 1. This approach helps understand the range of possible outcomes and the associated risks. The advantage over the risk distribution is that scenarios provide a narrative for specific risk events and their impact on the economy instead of a simple probability distribution.
Assuming that the forecast distribution is quantifiable (based on given models) and interpretable as a probability distribution, scenarios can be used to explore the main properties of this distribution.
What scenario analysis does the ECB do?
The ECB progressively refines its analyses, particularly in response to significant economic events. In the past we regularly published forecast ranges and sensitivity analyses, and only occasionally included ad-hoc scenarios related to international shocks. However, the COVID-19 pandemic marked a turning point in our approach. During this highly uncertain period we used different scenarios to reflect varying assumptions about the pandemic's progression. That provided insight into what was driving changes and supported discussing different options for action.
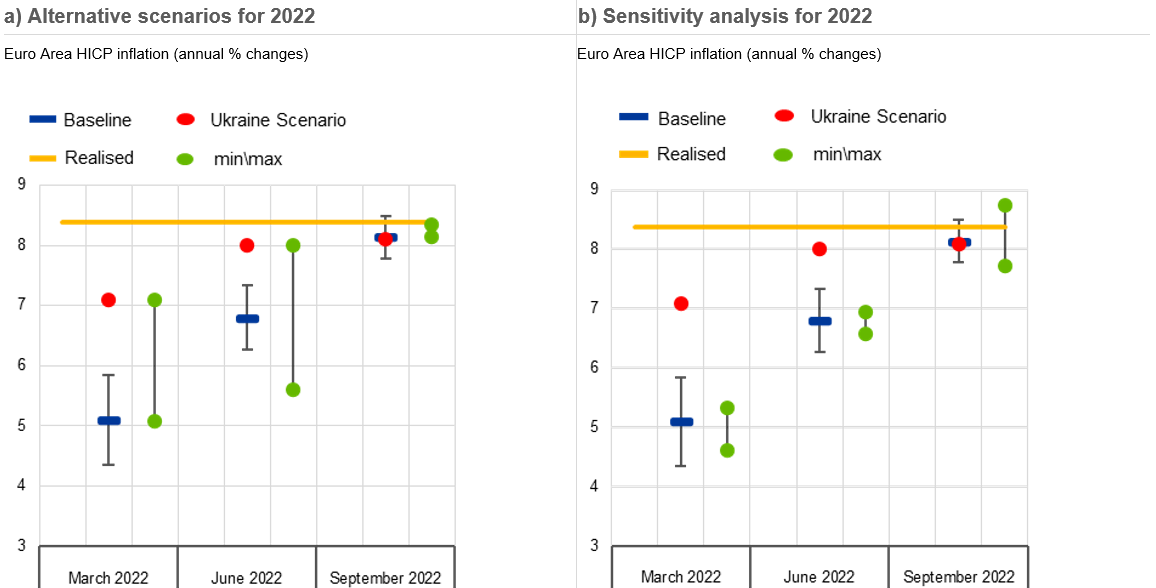
More recently, scenarios have been instrumental in assessing the impact of geopolitical tensions, such as the war in Ukraine and potential conflicts in the Middle East. For instance, the ECB developed scenarios to evaluate the effects of the Ukraine war and rising energy prices on inflation. This provided insights where standard sensitivity failed to account for extreme developments (Figure 2, panel a). The war in Ukraine and subsequent rises in energy prices led to a significant and unexpected surge in inflation. This could not have been foreseen in the central projections, given their conditionality on oil and gas price futures as expected by markets and other more standard assumptions. Nor could it have been foreseen by sensitivity analysis (Figure 2, panel b). Scenario analyses, however, did foresee this. Specifically, the assessment of scenarios helped by pointing to the risk of much stronger increases in energy commodity prices and consequently of much higher inflation in 2022 (the Ukraine war scenario published in March 2022 foresaw already 7% inflation in 2022, and around 8% in the June and September rounds). In this respect, the inflation scenario was useful to inform the ECB’s policy and its public communication.
Projections don’t usually look at the probability of “Black Swan” events – these are events which are very unlikely, but would have a huge impact - used, for example, in bank stress testing. This is an aspect that may deserve further attention, but it is unclear what the added value of such scenarios for monetary policy making is, unless there is also extreme uncertainty as, for example, during the pandemic.
Chart 2
Baseline projection, alternative scenarios and sensitivity analysis for inflation in 2022

Sources: ECB/Eurosystem staff projections and ECB staff calculation.
Notes: The ranges surrounding the respective baseline refer to a measure of uncertainty based on past projection errors, after adjustment for outliers, showing the 90% probability that the outcome of HICP inflation will fall within this interval. Panel a): Max and Min refer to the highest and lowest outcome from various scenarios including scenarios on the war in Ukraine, higher inflation expectations, real wage catch up etc. Panel b) Max and Min refer to the highest and lowest outcome from sensitivity analyses related to energy prices, exchange rates and market interest rates.
Scenario analysis: an invaluable complementary tool
Our experience shows that scenario analyses play an important role in macroeconomic projections by complementing aspects that are not included in the baseline forecasts. Together with sensitivity and risk analysis, they provide a robust toolkit to prepare for contingency or emergency planning and to give policymakers courses of action for alternative futures, and therefore better input to fulfil their mandate.
The views expressed in each blog entry are those of the author(s) and do not necessarily represent the views of the European Central Bank and the Eurosystem.
Check out The ECB Blog and subscribe for future posts.
For topics relating to banking supervision, why not have a look at The Supervision Blog?
Related topics
Disclaimer
Please note that related topic tags are currently available for selected content only.
