Recent developments in wages and the role of wage drift
Recent developments in wages and the role of wage drift
Prepared by Colm Bates, Katalin Bodnár and Kathinka Schlieker
Monitoring wages is a key element in the ECB’s approach to analysing the inflation outlook. This reflects the prominent role of wages in the dynamics of underlying inflation, in particular in the services component, which has remained persistent. The outlook for further disinflation in the September 2024 ECB staff macroeconomic projections is predicated inter alia on the expectation of moderating wage growth.
Euro area wage growth has been elevated since the post-pandemic reopening, also reflecting the inflationary shock following the outbreak of Russia’s unjustified war against Ukraine, but it is now showing signs of easing. A key indicator in the assessment of wage growth in the euro area is the annual growth rate of compensation per employee. This had strengthened successively to the elevated level of 5.5% in the second quarter of 2023 but eased to 4.8% in the first quarter of 2024 and further to 4.3% in the second quarter, representing a somewhat stronger moderation than expected in the September ECB staff projections. Other wage measures, such as compensation per hour, also show signs of easing. Despite this moderation, growth rates for the different indicators have remained elevated at around double their historical averages (of around 2.1% for all indicators). The long-term average also incorporates periods of low wage growth, and so should not be taken to indicate a target. Accordingly, the growth rates also remain above the wage growth consistent with the 2% inflation target and 1% productivity growth. This primarily reflects the strong impact of compensation for past high inflation and corresponding real wage catch-up (Chart A). Differences between growth in compensation per employee and growth in negotiated wages point to a role for “wage drift” in explaining wage dynamics.[1]
Chart A
Euro area labour cost indicators
(annual percentage growth rates)
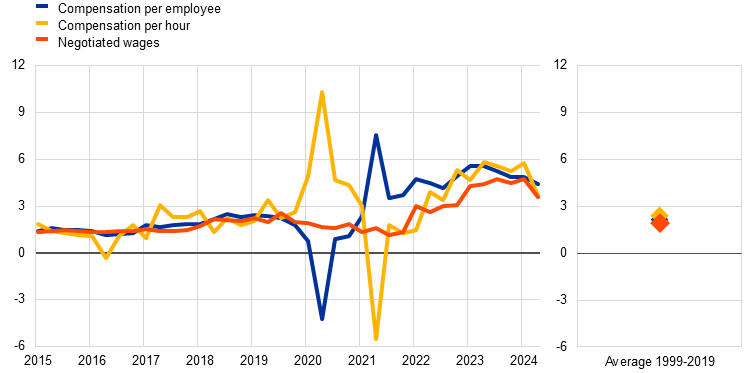
Sources: Eurostat, ECB and ECB staff calculations.
Notes: The latest observations are for the second quarter of 2024.
By definition, wage drift captures all elements of actually paid wages and salaries per employee which are not covered by collectively negotiated wages, such as individual bonus payments and overtime. Growth in compensation per employee can be decomposed into contributions from wages and salaries and employers’ social security contributions. Growth in wages and salaries per employee, in turn, consists of growth in negotiated wages and wage drift, the latter being calculated as the difference between the growth in wages and salaries per employee and the growth in negotiated wages. The euro area negotiated wage series captures the outcome of collective bargaining processes in terms of changes in an average or representative employee’s pay in the sectors covered. It also includes one-off payments where these are covered by the collective agreements. Wages and salaries, however, have other components that are not covered by collective agreements, including individual bonus payments and pay rises due to promotions. These are captured in the actual growth in wages and salaries per employee and consequently in wage drift. At the aggregate level, wage drift also reflects elements such as differences between the growth in individually as opposed to collectively negotiated wages, the importance of which increases as the number of workers covered by collective bargaining falls (and vice versa). Finally, as negotiated wages reflect the pay of a representative or average full-time employee, wage drift also captures changes in average hours worked (for example, through overtime or as a result of switching between full-time and part-time working) that determine actual pay. Some of these factors imply that wage drift can reflect short-term changes in economic conditions faster than negotiated wages, which are typically fixed for some time ahead. This makes wage drift an important element in the analysis of actual growth in employee compensation.
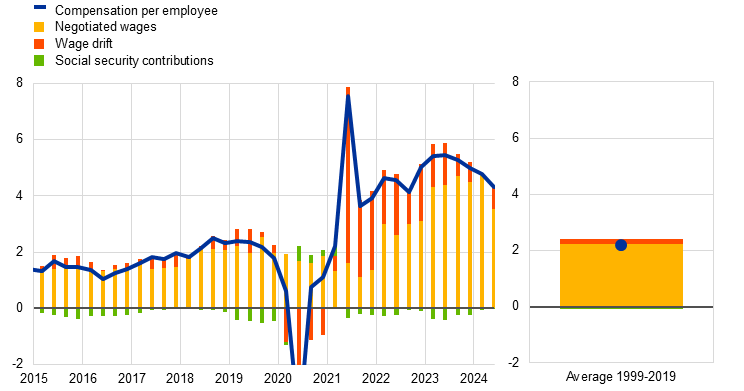
The recent moderation of the growth in compensation per employee has been driven by an easing of wage drift. Wage drift was a strong driver of growth in compensation per employee following the surge in inflation, which may reflect compensation for this surge being implemented earlier for individually negotiated contracts or coming ahead of time (possibly on a voluntary basis) for collectively negotiated contracts. Negotiated wages took over from wage drift in sustaining the upward pressure on growth in compensation per employee in 2023 and continued to do so into the second quarter of 2024 (Chart B). This shift in relative importance is in line with the notion that inflation compensation has, over time, been “reallocated” from the wage drift component to negotiated wages, both in the form of base wage increases and in one-off payments. The contribution of wage drift to growth in compensation per employee was on average 1.5 percentage points in 2022-2023, well above the contribution seen before the pandemic, and, despite some volatility, recent levels are still above the pre-pandemic average (0.2 percentage points between 1999 and 2019).
Chart B
Decomposition of growth in compensation per employee
(annual percentage growth rates and percentage point contributions)
Sources: Eurostat and ECB staff calculations.
Notes: In the left panel, the scale has been truncated on the downside for readability reasons. The value of growth in compensation per employee in the second quarter of 2020 was -4.2%. The latest observations are for the second quarter of 2024.
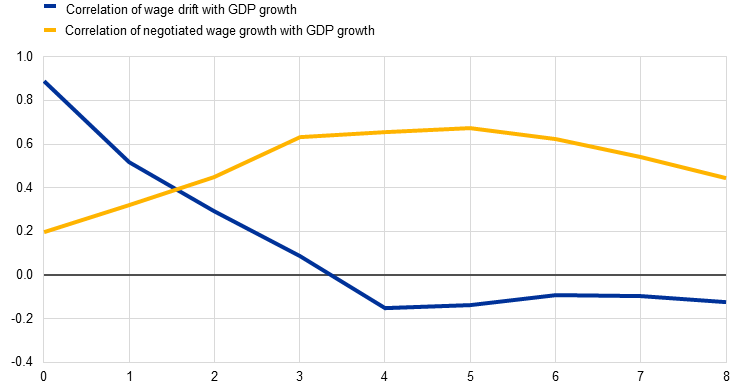
The recent period is thus an example of how economic conditions are more rapidly reflected in wage drift than in negotiated wage growth. In general, in a tight labour market in which employers wish to retain and reward employees, firms might offer pay to newly hired or incumbent employees at scales that are higher than those under the prevailing collective agreements, promote employees to higher bands within collectively agreed pay scales, or simply pay bonuses on top of agreed wages. In addition, employees not covered by collective agreements may be able to negotiate wage adjustments faster than trade unions that are bound by contract length. Both these factors would push up wage drift. The likelihood of all these happening increases in a situation where tight labour markets co-exist with substantial real wage losses due to high inflation. But as negotiated wage growth adjusts to the demand for inflation compensation, the contribution of wage drift moderates, eventually leading to opposite movements in the two main components of wage growth. Simple correlation analysis captures this in an earlier reaction of wage drift to the business cycle compared to negotiated wages. Chart C shows that wage drift has a high positive contemporaneous correlation with GDP growth which then declines, while negotiated wage growth reacts with a lag of several quarters.
Chart C
Correlation of wage drift and negotiated wages with real GDP growth
(correlation coefficient of annual growth rates)
Sources: Eurostat, ECB and ECB staff calculations.
Notes: The x-axis shows the number of quarters by which wage drift and negotiated wage growth are lagged compared to GDP growth. The calculations are based on data from 1999 to the second quarter of 2024. The results do not change fundamentally if only the pre-pandemic period (from the first quarter of 1999 to the fourth quarter of 2019) is considered.
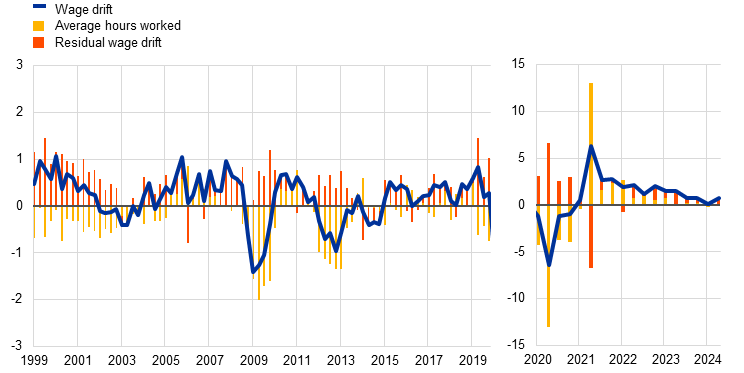
One channel through which the business cycle affects wage drift is average hours worked. When firms experience an increase in demand, the initial response is normally to ask employees to work more hours. Paid overtime is then reflected in wage drift. The strong contribution of average hours worked to wage drift immediately after the pandemic is, however, explained not by this cyclical effect but by the recovery in average hours worked as participation in job retention schemes declined (Chart D). This impact has moderated recently, contributing to an easing of wage drift. But the difference between wage drift and the growth in average hours worked was also somewhat larger recently, pointing to the role of inflation compensation.
Chart D
Decomposition of wage drift into growth in average hours worked and other factors
(year-on-year percentage growth and percentage point contributions)
Sources: Eurostat, ECB and ECB staff calculations.
Note: The latest observations are for the second quarter of 2024.
When interpreting developments in wage drift, some technical factors also need to be borne in mind. Average wages and salaries – and thus wage drift – can change when sectors or skill levels are associated with different pay rates and the composition of employment across these categories is changing. For example, during the pandemic, employment in tourism-related sectors, which typically have relatively low wage rates, was negatively affected and this is likely to have had an upward impact on growth in compensation per employee, which is then reflected in wage drift, making it somewhat countercyclical and partially offsetting other procyclical factors. Furthermore, the calculation of wage drift relies on the difference between two indicators with different country coverage: the negotiated wages series is aggregated from non-harmonised national data and does not cover all euro area countries, whereas compensation per employee is derived from the European System of Accounts, which covers all countries in a harmonised manner.[2] Owing to this difference in coverage, wage drift includes some aggregation bias, reflecting, for example, the fact that the Baltic States do not have data on collectively agreed wages but have had very high growth in compensation per employee.[3] This bias is normally very small, but it has been somewhat larger in recent quarters (0.2 percentage points on average between the first quarter of 2022 and the second quarter of 2024) than before the pandemic (0.1 percentage points between 1999 and 2019). Finally, as already discussed above, the effect of job retention schemes during the pandemic on compensation per employee was primarily reflected in wage drift, as negotiated wages were not affected by these distortions.[4]
To summarise, growth in compensation per employee can be divided broadly into negotiated wage growth and wage drift, with the latter leading the former through the economic cycle. While the euro area is still experiencing historically high levels of growth in compensation per employee, we are now at a point in the disinflation process where the upward pressure coming from wage drift is easing. Instead, as inflation compensation is increasingly embedded in collective wage bargaining, high negotiated wage growth has been sustaining the current levels of growth in compensation per employee. As the inflation surge has passed, there may be some residual real wage catch-up, but the upward pressure on negotiated wage growth is likely to subside.
-
See also the box entitled “Recent developments in the wage drift in the euro area”, Economic Bulletin, Issue 8, ECB, 2018.
-
The euro area negotiated wage series is compiled by the ECB on the basis of nine countries (Austria, Belgium, Germany, Spain, Finland, France, Italy, the Netherlands and Portugal) and covers approximately 94% of compensation of employees in the euro area.
-
Although in most euro area countries a majority of workers are covered by sectoral collective wage agreements, in a few countries a majority of employees are covered by firm-level bargaining. See also Górnicka, L. and Koester, G. (eds.), “A forward-looking tracker of negotiated wages in the euro area”, Occasional Paper Series, No 338, ECB, February 2024.
-
Revisions to compensation per employee growth are also primarily reflected in wage drift, as negotiated wage growth data are revised to a smaller degree.
Related topics
Disclaimer
Please note that related topic tags are currently available for selected content only.
Poslední zprávy z rubriky Makroekonomika:
Přečtěte si také:
Příbuzné stránky
- SHIBA INU - aktuální a historické ceny kryptoměny SHIBA INU, graf vývoje ceny kryptoměny SHIBA INU - 2 dny - měna USD
- SHIBA INU - aktuální a historické ceny kryptoměny SHIBA INU, graf vývoje ceny kryptoměny SHIBA INU - 5 dnů - měna USD
- SHIBA INU - aktuální a historické ceny kryptoměny SHIBA INU, graf vývoje ceny kryptoměny SHIBA INU - 3 roky - měna USD
- Floki Inu - aktuální a historické ceny kryptoměny Floki Inu, graf vývoje ceny kryptoměny Floki Inu - 2 dny - měna USD
- SHIBA INU - SHIB/ kurz
- Wage developments and their determinants since the start of the pandemic
- Inflation and the response of public wages in the euro area
- The Effects of Minimum Wage Increases in the Czech Republic - CNB WP 2/2021
- The role of housing wealth in the transmission of monetary policy
- Rejection of an application and the impact on the foreign national’s stay in the Czech Republic - Ministry of the interior of the Czech Republic
- Inflation developments in the euro area and the United States
- Ace in Hand: The Value of Card Data in the Game of Nowcasting - Česká národní banka
Prezentace
22.11.2024 Výsledková sezóna: Obhájila Nvidia svou…
18.11.2024 Nejlepší telefon za 2 990 Kč. Motorola má hit…
14.11.2024 Dosáhne Bitcoin 100 000 USD do konce roku?
Okénko investora

Radoslav Jusko, Ronda Invest
Dvojnásobný růst prodeje bytů oproti loňsku: Co to znamená pro ceny?

Petr Lajsek, Purple Trading

Olívia Lacenová, Wonderinterest Trading Ltd.
Jak trh reagoval na volby v USA? Historická maxima, ale i prudké propady

Jakub Petruška, Zlaťáky.cz
S návratem Donalda Trumpa zlato prudce klesá. Trhy zachvátila pozitivní nálada

Miroslav Novák, AKCENTA

Mgr. Timur Barotov, BHS

Jiří Cimpel, Cimpel & Partneři
Portfolio 60/40: Nadčasová strategie pro dlouhodobé investory

Ali Daylami, BITmarkets
Trump vs. Harris: komu majitelé kryptoměn coby voliči dají radši hlas?
