Modern monetary analysis (Philip R. Lane)
- SPEECH
Modern monetary analysis
Speech by Philip R. Lane, Member of the Executive Board of the ECB, at the Bank of Finland’s International Monetary Policy Conference
Helsinki, 26 June 2024
Introduction
My aim today is to discuss the modern role of monetary analysis at the ECB.[1] I will first review how monetary analysis has advanced over the twenty-five year history of the euro. Second, I will discuss how monetary analysis contributed to the assessment of financing conditions during the pandemic. Third, I will explain how monetary analysis has informed the diagnosis of the post-pandemic surges in inflation. Fourth, I will examine the contributions of monetary analysis to the calibration of the tightening cycle. Finally, I will speculate on the future role of monetary analysis.
The evolving role of monetary analysis
The initial monetary policy strategy of the ECB was based on a two-pillar framework to identify risks to price stability: economic analysis and monetary analysis. The two analytical domains essentially provided complementary perspectives on the economy.[2]
For the monetary pillar, the ECB’s Governing Council initially chose to emphasise the quantity of money among the key indicators to be closely monitored and established a reference value for the growth of a broad monetary aggregate (M3).[3]
This approach was in line with the views of early-day monetarists who considered money growth the primary source of inflation. Milton Friedman famously captured this in the adage that “inflation is always and everywhere a monetary phenomenon”. In an admittedly restrictive interpretation of Friedman’s statement, this is reflected in the quantity identity MV=PY.[4] This school of thought saw money as an imperfect substitute for a wide range of financial and real assets. A policy-induced injection of money into the economy would trigger complex and inter-related portfolio rebalancing across asset categories. This rebalancing would then lead to widespread changes in asset prices, yields and spreads across the economy. These mechanisms are well described in the classic 1988 monetarist account of transmission by Karl Brunner and Alan Meltzer.[5]
Especially after the end of the Bretton Woods system in 1973, some stability-oriented central banks – most notably the Deutsche Bundesbank – were looking for a substitute anchor, and these monetarist considerations played a significant role in the conduct of monetary policy throughout the 1970s, 1980s and 1990s. The result of that intellectual legacy was the prominent role that the ECB assigned to a reference value for money growth as an anchor back in 1998.[6] Deviations from that reference value and the associated “monetary overhang/shortfall” were, at the time, generally considered to signal risks to price stability.
However, a consistent record of difficulties within central banks in interpreting swings in monetary aggregates and in relying on them for predicting inflation at the horizons relevant for monetary policy contributed to a declining emphasis on money in policy making. As early as 1983, Bank of Canada Governor Gerald Bouey famously quipped “I would not say that we abandoned M1; I would say that M1 abandoned us, because of changes in banking practices”.[7] Even though Bouey was speaking about M1, the same instability problem applied to M3.
Moreover, by the time Michael Woodford came to write his seminal text Interest and Prices in 2003, there was a wide-spread view that it was not necessary to incorporate money in modern macroeconomic models.[8] Rather, the monetary policy stance could be summarised by the setting of interest rates alone.[9] Accordingly, money was all but removed from the modern monetary economics synthesis.
Against this background, the ECB conducted a review of its monetary policy strategy in 2003. This resulted in a revised approach to monetary analysis under the monetary pillar, with the adoption of a broader view of the role of money in the economy and the financial system. The long-term empirical relation between money and inflation had consistently been proven unhelpful in quantifying the scale of price pressures on a meeting-by-meeting basis. This realisation led to the discontinuation of the earlier practice of reviewing the reference value for M3, with a shift towards treating money aggregates as indicator variables rather than intermediate targets for monetary policy. The 2003 strategy review also clarified that monetary analysis served as a tool for cross-checking the short to medium-term indications from the economic analysis, from a medium to long-term perspective.[10]
After 2003, two significant developments led to an increased focus of monetary analysis on monetary policy transmission. First, the global financial crisis and the euro area sovereign debt crisis highlighted the vulnerability of the transmission mechanism. This, in turn, prompted policymakers to place greater reliance on monetary analysis in navigating the resulting challenges. Second, the adoption of unconventional monetary policy tools by the ECB of required monetary analysis to broaden its scope to better understand the many new transmission channels that the adoption of unconventional instruments had set in motion, including the analysis of potential side effects of those measures. Overall, the shift in focus of monetary analysis towards monetary policy transmission represented a natural evolution in line with the changing monetary policy landscape.
These developments were incorporated in monetary analysis during the latest strategy review conducted in 2021. In the new framework, “economic analysis” and “monetary analysis” no longer represent distinct perspectives on inflation. Instead, the interrelations between economic developments and monetary and financial developments are explicitly integrated into the overall assessment of inflation risks and the formulation of monetary policy.[11]
Accordingly, monetary analysis has expanded from a narrow focus on the quantity of money to the wider mechanism by which monetary policy actions transmit to the financing conditions faced by households and firms in the real economy.[12] This approach often employs monetarist concepts, formalised within modern structural models, to analyse changes in spreads and asset prices linked to portfolio rebalancing across imperfectly substitutable financial assets, including money and money-type assets.[13]
Monetary analysis played a particularly salient role in policy decision-making when the policy rate approached the effective lower bound. This period saw a significant expansion of liquidity in the financial system through central bank lending programmes and outright asset purchases, underscoring the importance of informed decision-making based on monetary analysis.
In the quantity identity (MV=PY), the traditional emphasis had primarily been on the growth rate of money, M. However, the bi-variate relation between inflation and money growth had not only always been elusive but also weakened over time, before disappearing altogether in the first decade of the 2000s (Chart 1).[14] Past studies had found a significant and stable relation between broad money growth and inflation across several economies and monetary regimes. However, this relation was observed at very low frequency over extremely long periods, limiting the degree to which it can be used in practice at the meeting-by-meeting frequency required for policy decisions.[15] Moreover, research incorporating recent experiences finds that structural shifts in banking and the financial system have destabilised the relation between money supply and inflation.[16]
Precisely for these reasons, since the global financial crisis, the importance of the bank lending channel and other transmission mechanisms has become more prominent. Monetary analysis has adapted by increasing the emphasis on analysing the credit-creation process, its relation with liquidity conditions and the various frictions affecting the financial system. All these elements affect the transmission of monetary policy to the real economy and thereby contribute to inflation dynamics.
Chart 1
Money growth and inflation
(annual percentage changes)
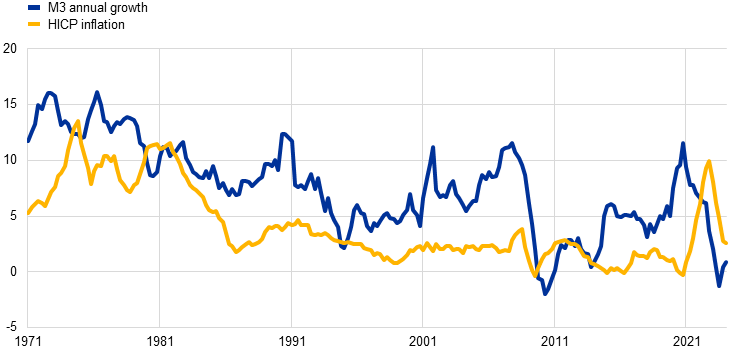
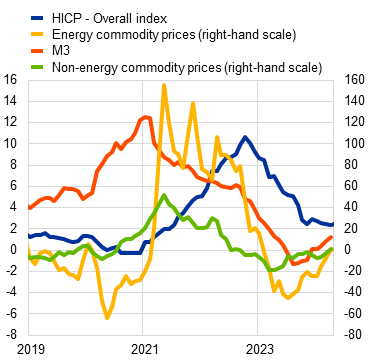
From this perspective, it would be overly reductive to interpret the rise of money growth during the pandemic and the subsequent rise in inflation that is shown in Chart 1 as a causal relation. In fact, the strong money growth in the early phase of the pandemic was driven by the build-up of liquidity buffers, which is not inherently inflationary.[17] This is consistent with the view that the surges in inflation in 2021 and 2022 were mostly related to supply-side factors, such as global supply bottlenecks and increases in energy and commodity prices, rather than an increased stock of money. This view is further reinforced by the nature of the inflation shock which involved large relative price movements, whereas money-induced inflation should have been associated with a more uniform increase in prices across categories. I will return to the pandemic episode later in this speech.
The wider availability of timely granular information on balance sheets, lending rates and deposit rates for euro area monetary financial institutions has offered increasingly detailed insights into bank-based transmission. We now have evidence that firm and bank balance sheet constraints can amplify the contraction in credit availability brought about by policy tightening.[18] More recently, the availability of loan- and transaction-level information on banks and firms has further enhanced the analysis of the monetary policy transmission mechanism along several dimensions, including: heterogeneity in the transmission of monetary policy across regions and sectors, the impact of monetary policy on bank risk-taking, and the sources of changes in credit developments.[19]
Financing conditions during the pandemic
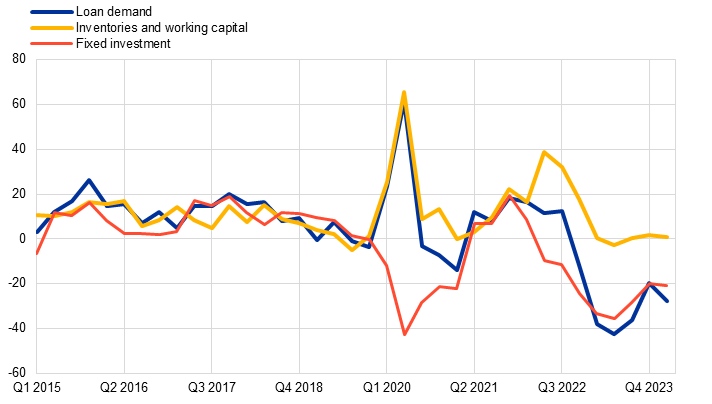
The pandemic period was marked by extraordinarily high liquidity demand, triggering a global dash for cash by investors. Lockdowns, social distancing measures and travel restrictions led many firms to experience a reduction in consumer demand and to reduce or halt their operations. This triggered a substantial decline in revenue for businesses across a wide range of sectors. However, firms still had to meet operating expenses and short-term obligations, such as the maintenance of inventories, payments to suppliers, salaries, taxes and fixed operational expenses. These needs showed up very clearly in the replies by banks to the ECB bank lending survey (BLS), which documented a surge in loan demand by firms to finance working capital, while financing needs linked to investment weakened considerably (Chart 2).[20]
Chart 2
Financing needs for inventories and working capital and loan demand by enterprises
(net percentages)
Source: ECB (BLS).
Notes: Net percentages for the questions on demand for loans are defined as the difference between the sum of the percentages of banks responding “increased considerably” and “increased somewhat” and the sum of the percentages of banks responding “decreased somewhat” and “decreased considerably”. The net percentages for responses to questions relating to contributing factors are defined as the difference between the percentage of banks reporting that the given factor contributed to increasing demand and the percentage of banks reporting that it contributed to decreasing demand.
In this environment, employment and total hours worked declined at the sharpest rates on record, with many employees being furloughed or having their working hours reduced. Consequently, salary incomes were dented. Banks across the euro area faced rising funding costs due to a climate of heightened uncertainty in the market and concerns about borrower creditworthiness. This led to a reassessment of risk, affecting not only banks but also the broader financial markets, as evidenced by the increase in corporate bond yields. In the absence of countervailing measures, banks would have struggled to secure funding, which would have limited their ability to meet the high demand for emergency loans, potentially crippling their lending capacity. Accordingly, it was crucial for our monetary policy to maintain favourable financing conditions and the effective transmission of monetary policy, in order to avert a monetary squeeze that would have exacerbated adverse effects from the pandemic on the economy and price stability.
The experience gained over the preceding decade allowed us to respond swiftly and decisively, deploying essentially two types of instruments. The first type was intended to maintain an accommodative monetary policy stance and, in parallel, stem the tide of an impending meltdown in financial markets as investors were pulling back from riskier assets. Here the main measures were the recalibration of the asset purchase programme (APP) and the introduction of the pandemic emergency purchase programme (PEPP).[21][22] The second group of instruments was deployed to ensure that the accommodative impulse would reach the broader economy. Notable examples include the recalibrations of the targeted longer-term refinancing operations (TLTROs) for banks at attractive conditions.[23] These term credit operations were aimed at expanding the quantity of central bank reserves, subject to the condition that banks would lend them on and keep credit flowing to the economy. As a facilitating measure, the targeted lending programme was accompanied by a temporary easing of collateral and regulatory constraints.
The interplay between policies to keep the risk-free curve low and steady across maturities, and instruments to unclog the transmission pipes worked as intended. The economics of the portfolio rebalancing channel learned during the first wave of the APP net purchases, over the period 2015-2018, as well as the experience of the portfolio movements during the sovereign debt crisis, were instrumental for the design of the PEPP. The portfolio rebalancing channel is the key mechanism through which central bank asset purchases transmits monetary policy to the broader economy.[24] This channel functions through the principle of imperfect substitutability among financial instruments, coupled with investor preferences for certain assets, known as preferred habitats.[25]
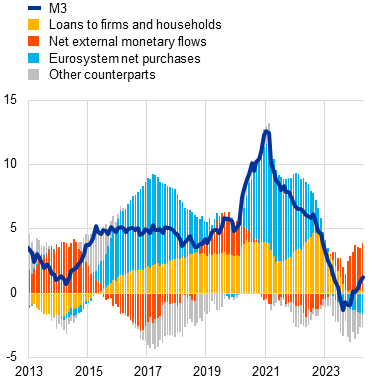
Monetary analysis studied how portfolio allocations can change directions both across instruments and between euro-denominated domestic assets and foreign assets. Within the euro area, the APP had led to a rebalancing of bank exposures from sovereign securities towards corporate securities and from bonds to real-sector loans, easing financing conditions to corporates and households in the process.[26] The shift towards foreign assets had been more pronounced among foreign investors, who were the main selling sector counterpart in the APP during the pre-pandemic period, but it was also evident among euro area investors (Chart 3).[27] This had played a significant role in explaining the limited effect that the APP had on the expansion of broad money supply before the pandemic, a phenomenon that was similarly observed during the third round of quantitative easing in the United States (Chart 4). In other words, the APP had exerted robust monetary transmission even in the absence of a strong expansion in the money supply, because the exchange rate channel had become a powerful substitute for the traditional money-creation mechanism that worked through the liability side of bank balance sheets.
Chart 3
Net portfolio investment in debt securities by euro area non-MFIs
(12-month flows in EUR bn)
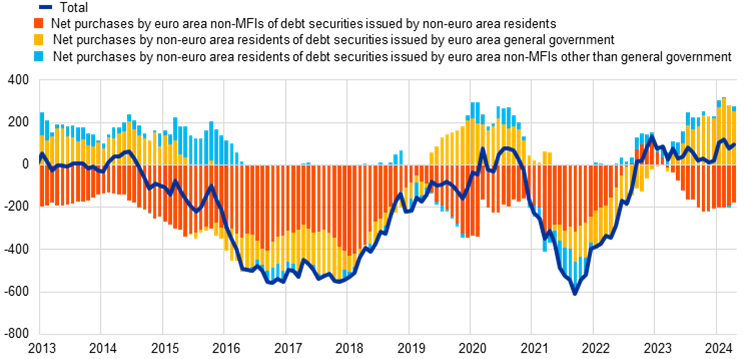
Sources: ECB (BPS) and ECB calculations.
Notes: As is common in the monetary presentation of the balance of payments, the b.o.p. items correspond to the non-MFI sector and display the sign that matches the related monetary flows, i.e. monetary inflows are shown with a positive sign and monetary outflows are shown with a negative sign.
Chart 4
Sources of money creation
|
Euro area |
United States |
|---|---|
| (annual percentage changes and contributions) | (annual percentage changes and contributions) |
 |
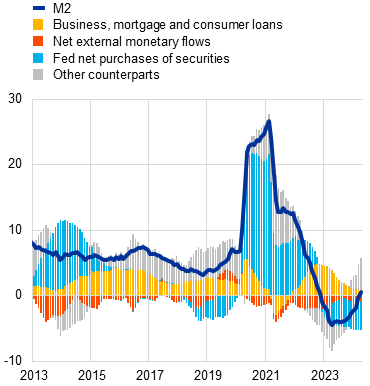 |
Sources: Left panel: ECB (BSI) and ECB calculations; right panel: Federal Reserve Board/Haver Analytics, Bureau of Economic Analysis and ECB calculations.
Notes: Panel a: Figures for M3 are adjusted for the operational incident in TARGET2 which inflated the September 2022 figures for OFI deposits and loans, reversing them in October and November 2022. Panel b: Net external monetary flows (which are the exchanges between the non-MFI sector and the rest of the world) are obtained by subtracting the contribution of deposit-taking institutions and central bank (where available) to the US b.o.p. They display the sign that matches the related monetary flows, i.e. monetary inflows are shown with a positive sign, monetary outflows are shown with a negative sign. The latest observation for that series is for Q1 2024, but the monthly flow for April 2024 is kept equal to that of March 2024. As required by the monetary framework, Eurosystem purchases includes securities issued by euro area non-MFIs.
The long-standing internal monetary analysis of the factors explaining the setting of bank lending rates was critical in the recalibration of existing TLTROs during the pandemic. In particular, the pricing of the new wave of TLTROs following the outbreak of the pandemic relied on the accumulated evidence that the unconventional policies deployed by the ECB had lowered various components of bank funding costs in the aftermath of the euro area sovereign debt crisis (Chart 5).[28] Empirical estimates indicate that, in the absence of the recalibration of the targeted lending programme, the ability of banks to supply credit would have been severely affected. Importantly, the lower amount of lending to firms would have led to a significantly larger decline in employment by firms.[29]
Chart 5
Lending rate to non-financial corporations and its components
(percentages per annum)
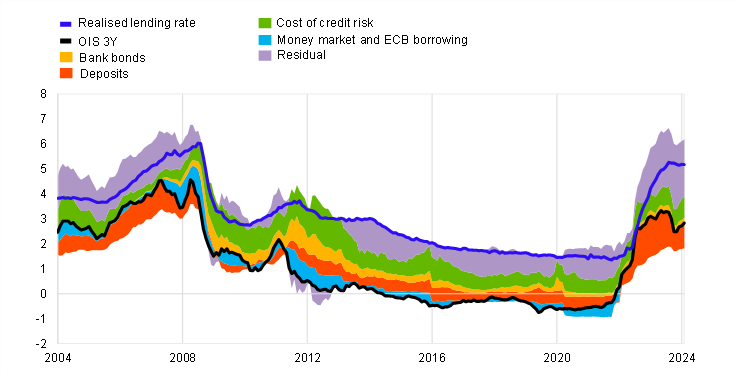
Sources: ECB (BSI, MIR), Bloomberg, Moody’s and ECB calculations.
Notes: The chart decomposes the realised lending rate on new loans to non-financial corporations (blue line) into contributions from bank cost components. The residual between the realised lending rate and the various cost components identifies a measure of intermediation margin. Deposits, bank bonds and money market and ECB borrowing are expressed as spreads vis-a-vis the base rate (i.e., the three-year overnight index swap (OIS), black line), weighted by their respective importance in banks’ funding mix. The latest observations are for April 2024.
The post-pandemic surges in inflation
The combination of extraordinarily high liquidity needs and our monetary policy measures to maintain favourable financing conditions boosted broad money growth. As a result, credit to firms and central bank purchases became the main sources of money creation. This composition reflected the broad division of tasks in the support given to the euro area economy, with the support to the corporate sector mostly channelled via bank credit (whose conditions were eased by monetary policy, government guarantees and regulatory measures) while the support to households was mostly channelled via the government sector. The latter, and thus the liquidity needs of the economy, explain the marked impact of central bank purchases on money growth in the early stages of the pandemic. In contrast to the 2015-2018 period, these purchases occurred alongside an increase in government borrowing. Such borrowing prevented the bond scarcity that large-scale asset purchases can imply, thereby averting the usual financial outflows to the rest of the world (Chart 4, left panel).
As economic activity resumed and lockdown restrictions were lifted, emergency liquidity needs declined and money growth also slowed. By October 2020, the three-month annualised growth rate of M3 had dropped to 7.5 per cent, which was about one-third of the 21.9 per cent rate seen at the peak of the lockdowns, and just somewhat above the historical average. The growth rate continued to decrease until mid-2022 even in the face of increased borrowing prompted by liquidity demands from the energy crisis. Shortly after we started hiking rates in July 2022, M3 growth even dipped into negative territory before recovering somewhat in the second half of 2023.
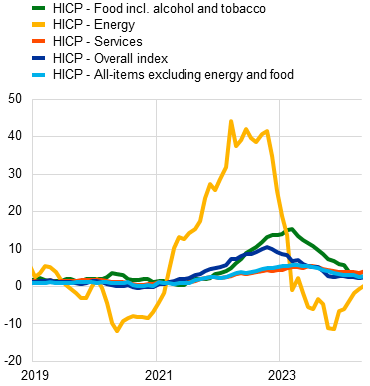
Inflation began to rise just as money growth slowed down. Initially, these price increases were concentrated in specific sectors, particularly affecting energy and food prices, rather than showing a broad-based increase across all goods and services, which would have been more consistent with a monetary origin for the inflation surge (Chart 6). These heterogeneous price increases align with the view that inflation was largely due to specific cost-push shocks passing through to the wider consumption basket. This perspective is supported by structural analyses identifying energy and food price shocks together with supply chain disruptions as the main culprits of the inflationary pressures.[30] It is also consistent with the interpretation that the robust money growth during the early stages of the pandemic was a result of accumulating liquidity reserves, which in turn were not inherently inflationary. Taken together, the evidence indicates that the recent inflation surge is primarily attributable to rising commodity prices and global supply constraints, rather than an expanding money supply.[31]
Chart 6
Headline inflation, money growth and commodity prices, and headline inflation and subcomponents
The surge in borrowing by firms, which peaked during the second quarter of 2020 amid the initial lockdowns, was primarily driven by need for working capital and precautionary reasons. Borrowing by firms closely matched their increases in cash reserves. Since this borrowing was not for investment purposes, it did not stimulate aggregate demand.
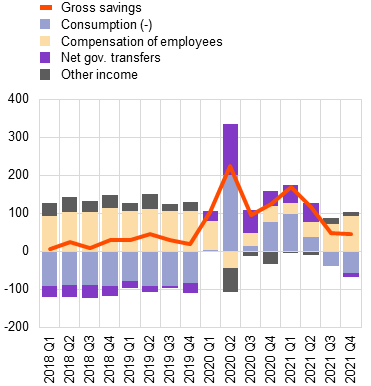
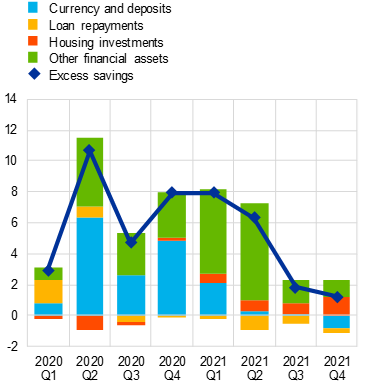
Household behaviour points to a similar message. Government aid to households served to cushion their reduced income rather than to increase spending: fiscal transfers only covered part of the slowdown in household income over the pandemic period. Most of the excess savings accumulated during the pandemic resulted from falling consumption, which was much larger than the drop in income (Chart 7, left panel). This decline in consumption was partly forced by the reduced consumption opportunities due to the pandemic restrictions but it is likely to have also reflected precautionary behaviour related to uncertainty about the future. The latter led to an increased preference for liquidity, and indeed a large part of household excess savings were accumulated in the form of overnight deposits, especially in the initial phases of the pandemic (Chart 7, right panel).[32]
Chart 7
Savings over the pandemic period
Consumption only started to approach its pre-pandemic level by the middle of 2021, but households continued to express their willingness to maintain a higher level of savings or financial investments, a considerable part of which remained in overnight deposits. This composition also reflected the flattening yield curve and the low opportunity cost of holding those deposits.[33]
Chart 8
Individual consumption of selected goods and services and corresponding price developments
(left-hand scale: chain-linked EUR bn; right-hand scale: annual percentage changes)
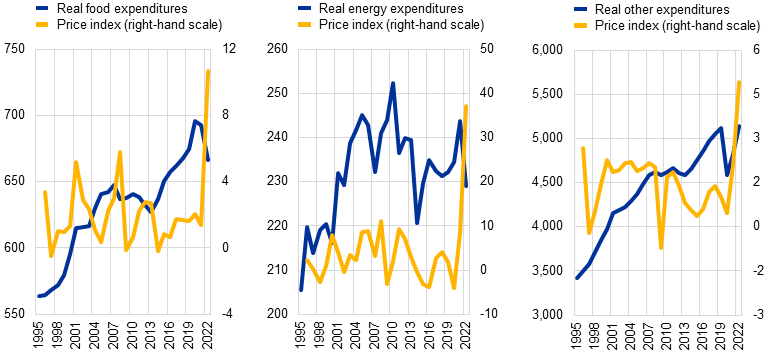
As energy and food prices began to rise, households moderated their accumulation of deposits but also reduced the real consumption of those products (Chart 8). The configuration of falling consumption and rising prices for energy and food is consistent with supply shocks driving energy and food prices rather than reflecting a surge in domestic demand.[34] In addition, falling consumption also indicates that the excess deposits accumulated during the pandemic did not lead to households being insensitive to more expensive and energy and food bills.
Chart 8 also shows that, as the economy reopened and uncertainty receded, household consumption volumes of items other than energy and food rebounded towards pre-pandemic levels despite the price increases in those items in the course of 2021 and 2022. While the configuration of rising consumption and rising prices might suggest some role for domestic demand, consumption of these items remained clearly below the previous trend. It is certainly the case that, for a given surge in supply-driven inflation, excess savings allowed households to cut consumption by less than if the supply shock had happened at a time when excess savings were lower.
The coexistence of high inflation and only a moderate consumption recovery serves to underline the scale of supply-driven cost pressures during 2021 and 2022: only a dramatic monetary and/or fiscal tightening would have been needed to eliminate the inflation surge by reducing domestic demand sufficiently (involving a severe drop in domestic incomes) to match the reduction in supply capacity.
Overall, although real private consumption and investment have rebounded in the post-pandemic period, these have not reached the levels projected in mid-2021 when excess savings were at their highest, and real private consumption continues to trail the forecasts made before the pandemic. In this context a dramatic recession would have been required to fully avoid an inflation surge.[35]
The tightening cycle
Monetary analysis has been central to the regular assessment of the state of the monetary policy transmission, which has been a key guiding principle in calibrating the speed and scale of the monetary policy tightening over the last couple of years.[36]
Focusing on the propagation of that tightening impulse through the banks, both the rate hikes that started in July 2022 and the sustained upshift in the yield curve that preceded and accompanied that process led to a significant rise in bank funding costs, initially driven by bonds and subsequently by deposit rates (Chart 9). The latter adjusted with a lag, owing to the atypical interest rate configuration during the negative rate period, but eventually aligned with our policy signal (Chart 10).
Chart 9
Bank funding costs
(percentages per annum)
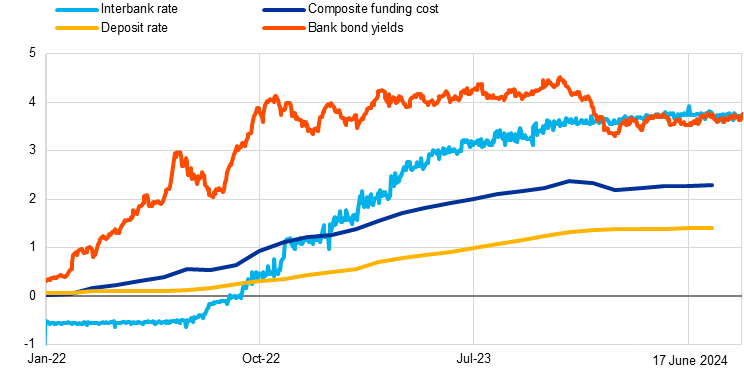
Sources: ECB (BSI, MIR, CSDB, MMSR) and ECB calculations.
For monthly data, the latest observations are for April 2024, for daily data, the latest observations are for 17th June.
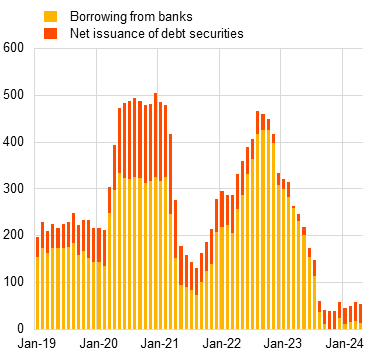
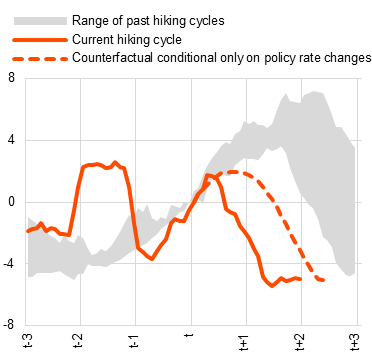
In parallel, loan volumes in the euro area have experienced a marked decline since late 2022. After dropping sharply, credit flows have remained stagnant for both loans and bonds (Chart 11, left panel). The pronounced decline in credit compared to previous hiking cycles (Chart 11, right panel) was largely due to the sharp increase in interest rates, which has significantly dampened demand, as also reflected in the ECB bank lending survey (BLS). Initially, credit demand showed some resilience, primarily driven by the liquidity needs of firms during the peak of the energy crisis. However, it began to contract in the last quarter of 2022 and continued to do so for several months after the last rate hike in September 2023. The primary drivers behind the weakness in demand were elevated interest rates and reduced recourse to credit for financing investments, which reflects the "cost of capital” channel of monetary policy (Chart 12).
Chart 10
Transmission to deposit rates
(percentages per annum)
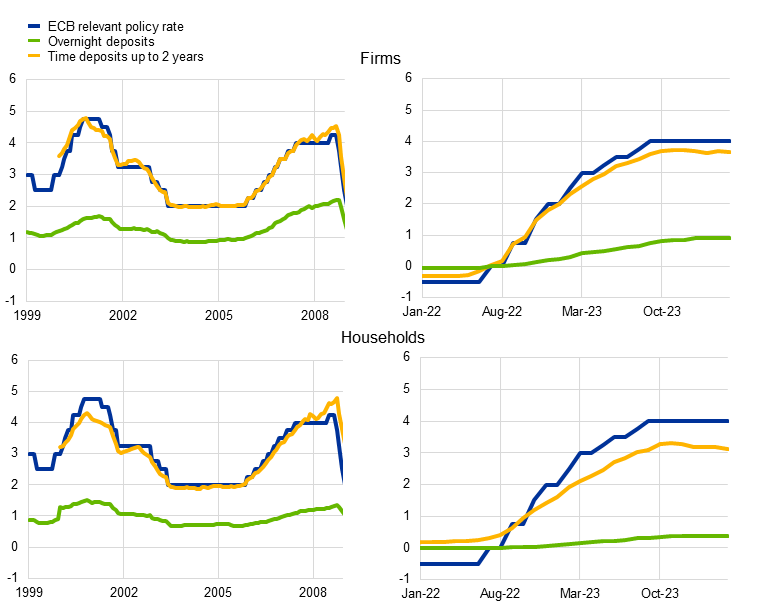
Sources: ECB (MIR, FM) and ECB calculations.
Notes: The ECB relevant policy rate is the MRO for the 1999-2008 panels and the DFR for the panels starting on 2022.
Chart 11
Firm debt financing (left side), and comparison of slowdown in loan dynamics to past regularities (right side)
Sources: ECB (BSI, CSEC) and ECB calculations.
Notes: MFI loans are adjusted for sales and securitisation and cash pooling. The seasonal adjustment of the net issuance of debt securities is not official. The dotted line corresponds to a BVAR counterfactual for lending volumes, taking December 2021 as the latest observation and projecting volumes conditional on the path of monetary policy rates. The type of BVAR used is the one used by Giannone, D,, Lenza, M. & Primiceri, G., (2015),”Prior Selection for Vector Autoregressions”, The Review of Economics and Statistics, 97, issue 2, p. 436-451; and Altavilla C., Giannone D. & Lenza M. (2016), “The financial and macroeconomic effects of OMT announcements”, International Journal of Central Banking, vol. 12(3), pages 29-57. The latest observations are for April 2024.
Chart 12
Loan demand by firms and contributing factors during the tightening cycle
(net percentages of banks reporting an increase in demand, and contributing factors)
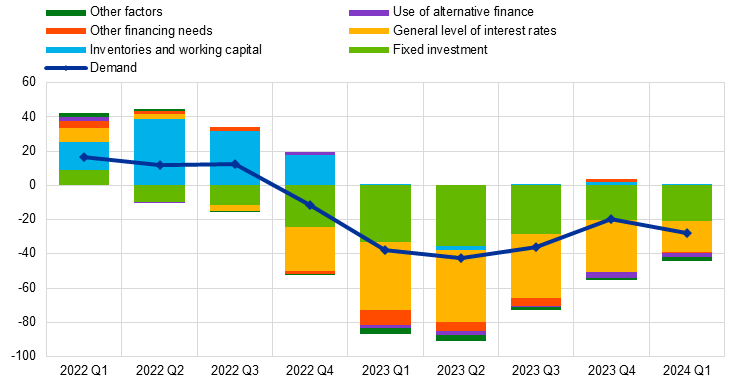
Source: ECB (BLS).
Notes: Net percentages for the questions on demand for loans are defined as the difference between the sum of the percentages of banks responding “increased considerably” and “increased somewhat” and the sum of the percentages of banks responding “decreased somewhat” and “decreased considerably”. The net percentages for responses to questions relating to contributing factors are defined as the difference between the percentage of banks reporting that the given factor contributed to increasing demand and the percentage of banks reporting that it contributed to decreasing demand. “Other financing needs” is the unweighted average of “mergers/acquisitions and corporate restructuring” and “debt refinancing/restructuring and renegotiation”; and “Use of alternative finance” is the unweighted average of “internal financing”, “loans from other banks”, “loans from non-banks”, “issuance/redemption of debt securities” and “issuance/redemption of equity”. The net percentages for “Other factors” refer to an average of the further factors which were mentioned by banks as having contributed to changes in loan demand.
At the same time, a decline in the supply of credit from banks has also played a large role in the recent credit slowdown. Credit supply effects primarily stemmed from a decreasing willingness of banks to take risks. This, in turn, has affected lending conditions for firms and households. The start of the reimbursement phase for TLTROs and the change in the conditions applied by on TLTRO borrowings reinforced the incentives for banks to scale down loan exposures.[37] Studies using granular data to control for demand conditions indicate that increased borrowing costs for banks have resulted in a significant reduction in lending volumes. In other words, the significant decrease in loans was partly due to the tighter lending conditions, rather than being solely due to lower credit demand. Our bank lending survey corroborates this view, highlighting that heightened risk perception and reduced risk tolerance on the part of banks were significant factors influencing the tightening of credit standards during the hiking cycle.
In parallel, money growth, which had been declining rapidly from its 2021 peak, saw its decline accelerate, mirroring the contemporary contraction in bank lending and the progressive reduction of the monetary policy securities portfolio of the Eurosystem. Two liability-side factors reinforced the contraction in the availability of cheap funding: first, banks substituting TLTRO funding for long-term bonds; and second, a strong portfolio rebalancing by households and firms on the liability side of bank balance sheets.
In particular, the increased remuneration of time deposits and bonds after a long period of low or negative interest rates has incentivised shifts to these instruments from overnight deposits and other low-remuneration deposits. During the period of low interest rates, the opportunity cost of holding overnight deposits was very low, causing households and firms to prefer overnight deposits. The monetary policy tightening and its transmission to deposit rates and yields on other financial assets, has increased the opportunity cost of holding overnight deposits to levels similar to those seen in previous hiking cycles. This has led households and firms to move a significant portion of their unusually large stock of overnight deposits to time deposits and bonds (Chart 13).[38]
The high level of liquidity within the banking system has not impeded the transmission of our monetary policy tightening to households and businesses. Although in the cross-section banks with greater excess liquidity at the onset of the tightening cycle have reduced their lending to a lesser extent than their less liquid peers, the overall transmission of monetary policy has been robust and, if anything, been stronger than in previous cycles.
The apparent differences between the cross-sectional and time series results can be reconciled as follows. From a theoretical standpoint, excess reserves on the balance sheets of banks exert dual effects during a period of monetary tightening. On one side, the initiation of an unexpected tightening phase allows banks with excess reserves to benefit from higher returns on these reserves. This helps bolster their profits, potentially augments their capital buffers, relaxes constraints and ultimately expands the supply of lending. This wealth effect is in line with the results of the cross-sectional analysis.[39] At the same time, as the remuneration of reserves increases, these reserves become increasingly attractive to banks, as these represent a highly remunerated, secure and liquid asset. As a result, banks may be reluctant to extend their lending or to invest in bonds unless the price of these financial instruments is sufficiently attractive. This substitution effect may well have been the prevailing force in the aggregate transmission of our monetary policy.[40]That is to say, while the wealth effect may explain the cross-sectional variation in lending behaviour among banks with differing levels of excess liquidity, the substitution effect likely contributed to the strong transmission of monetary tightening on an aggregate level.
As the quantity-theory expression MV=PY makes clear, the connection between outside money – the currency and reserves supplied by the central bank – and prices is mediated by adjustments in velocity. Velocity is a complex function of a host of factors, some of which pertain to the decisions by banks to intermediate credit, others having to do with the decisions by different types of money holders on the financial instruments in which they want to keep their wealth. All else equal, credit creation pushes up velocity and thereby, for a given level of real income, generates price pressures. Conversely, portfolio reallocations towards larger money holdings serves to reduce velocity and weaken inflation for a given stock of outside money.
In a nutshell, these two factors have been offsetting each other in recent years. When loans were rapidly expanding in the early phase of the pandemic crisis, a sharp rise in liquidity preference – and the short-term bridging nature of the loans themselves – attenuated the inflationary potential of money growth. When eventually portfolios started shedding excess liquidity – a potential source of inflation – loans began to decline in parallel, providing a cushion against money-generated inflationary pressures.
Chart 13
Financial investment by households
(for bars: quarterly flows as percentage of annual GDP; for lines: percentage points)
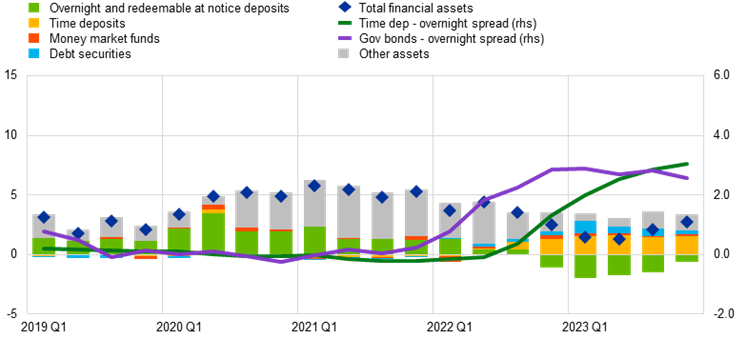
Sources: ECB (BSI, QSA, MIR, FM), Eurostat and ECB calculations
Notes: ‘Government bonds’ yields used for the spread calculation are those on 2-year government bonds.
Future challenges
Looking ahead, a prominent challenge for monetary analysis is to understand how the normalisation of the balance sheets of central banks may affect transmission in the years to come.
Measures that expand the central bank balance sheet stimulate bank lending and risk-taking through three main channels.[41] First, the decrease in long-term interest rates associated with the purchases of long-term securities by the central bank lowers borrowing costs for businesses and consumers, ultimately stimulating their loan demand. Second, investors (including banks and other financial institutions) that sell assets to the central bank try to rebalance their portfolio towards higher-yielding investments, which can also lead to increased lending supply.[42] Third, the liquidity injected into the banking system via central bank purchases of financial assets can enhance the capacity of banks to lend because that type of liquidity, perceived to remain in the system for a long time, may be seen as providing a permanent means to service the mobile type of deposits that are the by-product of an extension of bank credit.
In studying this critical nexus with the help of monetary analysis, it is worth recalling the notion of the “money multiplier”. Based on this mechanism, in a fractional reserve banking system a policy-induced expansion of the free reserves of cash held by the banks spurs, through successive rounds of loan and deposit creation, increasing volumes of credit and inside money. Outright central bank asset purchases increase bank reserve holdings and prompt banks to try to minimise the associated liquidity surplus – which is costly – by creating credit and other claims on those surplus reserves in an effort to enhance shareholder returns. This mechanism helps explain the strong connection of credit with reserve creation in times of QE, even when controlling for demand-for-credit effects as lending rates decline as a result of QE. In the other direction, a withdrawal of reserves sets in motion a cumulative process by which credit and deposits shrink by a multiple of the original negative shock to the reserve holdings.[43] It follows that, in order to assess the implications of QT, it is important to trace all the implications of the central bank balance sheet contraction for asset prices and credit in an encompassing framework and to take into account the relation between central bank liquidity and bank intermediation capacity.[44]
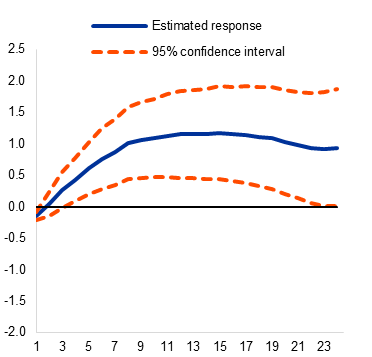
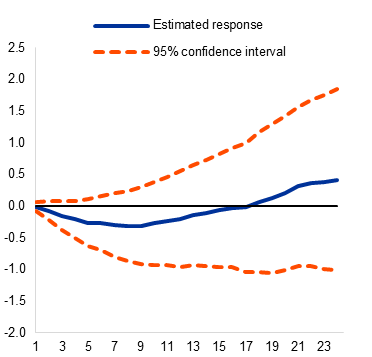
The relevance of the money multiplier is also supported by recent empirical analysis using comprehensive bank-level and loan-level data on lending from euro area banks to firms. A recent ECB study draws two main conclusions. First, the availability of central bank liquidity significantly influences banks' credit provision, in what the authors call a “reserve availability channel” of monetary policy. Second, the source of central bank reserves affects their impact on bank intermediation: non-borrowed reserves – those created as a result of a securities purchase programme – have very strong empirical connection with bank loans, whereas this is not the case for borrowed reserves drawn by banks from a short-term refinancing facility (Chart 14).[45]
Chart 14
Response of bank loans to an increase in borrowed and non-borrowed reserves
|
a) Non-borrowed reserved |
b) Borrowed reserves |
|---|---|
| (x-axis: months after the increase in reserves, y-axis: percentage points) | (x-axis: months after the increase in reserves, y-axis: percentage points) |
 |
 |
Sources: Altavilla, Rostagno, Schumacher (2024).
Notes: The chart reports the response of bank loans after a 1pp increase in non-borrowed reserves (left side) and borrowed reserves (right side). The solid lines report the estimated response, while the dashed lines report the 95% confidence intervals for each horizon.
These mechanisms are in line with a growing body of empirical studies focusing on the relation between central bank reserves and bank lending. Examples include analyses that show that: (a) banks that increased their reserve holdings, following the third round of quantitative easing announced by the Federal Reserve, increased lending; (b) banks with higher excess reserve holdings grant more credit lines and take more risk; (c) the reallocation of central bank reserves towards banks with higher liquidity needs fosters credit supply; and (d) the credit supply of reserve-rich banks is less sensitive to monetary policy tightening than that of other banks.[46]
Conclusions
As I have covered in this lecture, modern monetary analysis is helping policymakers to analyse the nexus of money, credit and the economy. Moreover, the frontier in modern monetary analysis is continuing to expand: the enhanced availability of granular data, filtered through an expanding computation capacity and new machine learning techniques, is further broadening its scope and the relevance of its findings for the calibration of monetary policy. For these reasons, monetary analysis plays a central role at the ECB, with a data-dependent approach to assessing the effectiveness of monetary policy transmission a key element in our reaction function.
-
I am grateful to Ramón Adalid, Alessandro Ferrari, Andrew Hannon and Sofía Velasco for their contributions in preparing these remarks and also the assistance of Lucía Kazarian, Silvia Scopel, Marina Dimitriou, Andreas Kapounek, Nikoleta Tushteva, Emma Vergauwen and Wouter Wakker. The term “modern monetary analysis” is intended to capture the current role of monetary analysis in central banking, as opposed to a traditional interpretation of the role of monetary analysis. The framework of modern monetary analysis is not to be confused with the much-discussed framework of modern monetary theory.
-
For a review of the evolution of ECB policy instruments and targets during its first two decades of existence, see Rostagno, M., Altavilla, C., Carboni, G., Lemke, W., Motto, R., Saint Guilhem, A. and Yiangou, J. (2021). “Monetary policy in times of crisis: A tale of two decades of the European Central Bank”, Oxford University Press. See also Papademos, L., & Stark, J. (2010), “Enhancing monetary analysis”, European Central Bank; Issing, O. (2000), “Communication challenges for the ECB”, speech at the CFS research conference "The ECB and its watchers II”,Panel II: "The ECB and Its Communication Strategy", Frankfurt, 26 June 2000; and European Central Bank. (1999), “The stability-oriented monetary policy strategy of the eurosystem”, ECB Monthly Bulletin, (January), 39-50.
-
See Klöckers, H.-J., and Willeke, C. (2001), ”Monetary analysis: Tools and applications”, ECB.
-
To be sure, the quantity identity predates Friedman’s statement by a couple of centuries, as it is already clearly implicit in David Hume’s “Political Discourses” (1752), although the “V” part of the equation was certainly under-appreciated and the identity tended to be understood as a casual relationship rather than an identity. In the equation, “M” is the total stock of outside money, i.e. the monetary aggregate that reflects liquidity injections by the central bank: in modern times, currency and reserves. “V” is the velocity with which money circulates, “P” is a price index, and “Y” is a measure of real economic activity. See Lucas, R. E., Jr. (1980),”Two illustrations of the quantity theory of money”, American Economic Review, 70(5), 1005-1014; and Sargent, T. J., and Surico, P. (2011), “Two illustrations of the quantity theory of money: Breakdowns and revivals”, American Economic Review, 101(1), 109-128.
-
See Brunner, K., and Meltzer, A. H. (1988),” Money and credit in the monetary transmission process”, American Economic Review, 78(2), 446-451.
-
The Deutsche Bundesbank continued to announce a target for the growth rate of its broad monetary aggregate M3 until the end of 1998, when the responsibility for monetary policy passed to the ECB. Other European central banks, including the Banque de France, the Banca d’Italia, and the Banco de Espana, also announced monetary targets or reference ranges complementing other aspects of their monetary policy strategies, such as exchange rate targets and/or direct inflation targets. See Gerlach, S., and Svensson, L. E. O. (2003), “Money and inflation in the euro area: A case for monetary indicators?”, Journal of Monetary Economics, Vol. 50, Issue 8, pp. 1649-1672.
-
House of Commons Committees (1983), Minutes of Proceedings and Evidence, Standing Committee on Finance, Trade and Economic Affairs, Vol. 6, No 134, 28 March, p. 12.
-
See, for example, Goodfriend, M. and King, R.G. (1997), “The New Neoclassical Synthesis and the Role of Monetary Policy”, in Bernanke, B.S. and Rotemberg, J.J. (eds.), NBER Macroeconomics Annual: 1997, Cambridge, MA: MIT Press; Clarida, R., Galí, J. and Gertler, M. (1999), “The Science of Monetary Policy: A New Keynesian Perspective”, Journal of Economic Literature, Vol. 37(4), pp. 1661-1707.
-
See Woodford, M. (2003), “Interest and prices: Foundations of a theory of monetary policy”, Princeton University Press. He explains that, in a world where financial markets had become highly efficient, it is sufficient to limit attention to the overnight rate and let financial markets take care of arbitraging across any opportunities created by discrepancies in the yields on different market instruments. See also Orphanides, A. (2007), “Taylor rules”, in Blume, L. and Durlauf, S. (eds.), The New Palgrave: A Dictionary of Economics, Houndmills, Basingstoke: Palgrave Macmillan.
-
Other central banks had followed the same paradigm shift in parallel to the adoption of explicit inflation targets, like the Bank of England and the central banks of New Zealand and Canada in the early 1990s. See King, M. (2005), “Monetary Policy: Practice Ahead of Theory”, speech by Mervyn King at the Mais Lecture, Cass Business School, City University, London, 17 May, and Goodfriend, M. (2007), “How the World Achieved Consensus on Monetary Policy”, Journal of Economic Perspectives, Vol. 21(4), pp. 47-68. Real money balances continued to play a role in macroeconomic models, however; see, for example, Ireland, P.N. (2004), “Money's Role in the Monetary Business Cycle”, Journal of Money, Credit and Banking, Vol. 36(6), pp. 969-983; Christiano, L., Motto, R. and Rostagno, M. (2003), “The Great Depression and the Friedman-Schwartz Hypothesis”, Journal of Money, Credit and Banking, Vol. 35(6), pp. 1119-1197; and Andrés, J., López-Salido, J.D. and Vallés, J. (2006), “Money in an Estimated Business Cycle Model of the Euro Area”, Economic Journal, Royal Economic Society, Vol. 116(511), pp. 457-477, April.
-
See Holm-Hadulla, F., Musso, A., Rodriguez Palenzuela, D. and Vlassopoulos, T. (2021), “Evolution of the ECB’s analytical framework”, Occasional Paper Series, No 277, ECB; Deutsche Bundesbank (2023), “From the monetary pillar to the monetary and financial analysis”, Monthly Report, January; and Schnabel, I. (2023), “Money and inflation”, lecture at the annual conference of the Verein für Socialpolitik, Regensburg, 25 September.
-
This remedied a clear lack of banks as key agents in the transmission of monetary policy even in the new paradigm, as noted in Goodhart, C.A.E. (2004), “Review of Interest and Prices by M. Woodford”, Journal of Economics, Vol. 82(2), 195200. See also Goodfriend, M. and McCallum, B.T. (2007), “Banking and interest rates in monetary policy analysis: A quantitative exploration”, Journal of Monetary Economics, Vol. 54, Issue 5, pp. 1480-1507; Canzoneri, M., Cumby, R., Diba, B. and López-Salido, D. (2008), “Monetary Aggregates and Liquidity in a Neo-Wicksellian Framework”, Journal of Money, Credit and Banking, Vol. 40(8), pp. 1667-1698, December.
-
See also Christiano, L. and Rostagno, M. (2001), “Money Growth Monitoring and the Taylor Rule”, NBER Working Paper Series, No 8539, National Bureau of Economic Research; Goodhart, C. (2007), “Whatever became of the monetary aggregates?”, National Institute Economic Review, No 200, pp. 56-61; and Pill, H. (2022), “What did the monetarists ever do for us?”, speech by Huw Pill at Walter Eucken Institut / Stifung Geld und Währung Conference – Inflation and Debt: Challenges for Monetary Policy after Covid-19, Freiburg im Breisgau, 24 June.
-
See, for instance, De Grauwe, P. and Polan, M. (2005), “Is inflation always and everywhere a monetary phenomenon?”, Scandinavian Journal of Economics, Vol. 107(2), pp. 239-259; Berger, H., Karlsson, S. and Osterholm, P. (2023), “A note of caution on the relation between money growth and inflation”, IMF Working Papers, No 2023/137, International Monetary Fund; and Jung, A. (2024), “The quantity theory of money, 1870-2020”, Working Paper Series, No 2940, ECB.
-
See, for instance, Benati, L. (2009), “Long run evidence on money growth and inflation”, Working Paper Series, No 1027, ECB; Borio, C., Hofmann, B. & Zakrajšek, E. (2024), “Money growth and the post-pandemic surge in inflation”, VoxEu, January 2024.
-
King, M.A. (2024), “Inflation Targets: Practice Ahead of Theory”, NBER Working Paper Series, No 32594, National Bureau of Economic Research.
-
This is in line with the results set out in Deutsche Bundesbank (2023), “From the monetary pillar to the monetary and financial analysis”, Monthly Report, January, which also concludes that it is unlikely that the high money growth in 2020 caused the rise in inflation seen in 2021-2022. Broadbent, B. (2023), “Monetary policy: prices versus quantities”, speech at the National Institute of Economic and Social Research, London, 25 April, also argues that those buffers could not account for the subsequent upside surprise in inflation.
-
Following monetary policy tightening, the transmission of monetary policy is found to be stronger for banks that are (i) poorly capitalised (e.g. Van den Heuvel, S. (2002), “Does bank capital matter for monetary transmission?”, Federal Reserve Bank of New York Economic Policy Review, Vol. 8); (ii) small (e.g. Kashyap, A. and Stein, J. (1995), “The Impact of Monetary Policy on Bank Balance Sheets”, Carnegie-Rochester Conference Series on Public Policy, Vol. 42); and (iii) illiquid (e.g. Bernanke, B. and Gertler, M. (1990), “Financial Fragility and Economic Performance”, The Quarterly Journal of Economics, Vol. 105).
-
See Altavilla, C., Gürkaynak, R. and Quaedvlieg, R. (forthcoming), “Macro and Micro of External Finance Premium and Monetary Policy Transmission”, Journal of Monetary Economics.
-
See Acharya, V.V. and Steffen, S. (2020), “The Risk of Being a Fallen Angel and the Corporate Dash for Cash in the Midst of COVID”, The Review of Corporate Finance Studies, Vol. 9, Issue 3, pp. 430-447.
-
See Rostagno, M., Altavilla, C., Carboni, G., Lemke, W., Motto, R. and Saint Guilhem, A. (2021), “Combining negative rates, forward guidance and asset purchases: identification and impacts of the ECB’s unconventional policies”, Working Paper Series, No 2564, ECB.
-
The PEPP was designed to ensure that the monetary policy stance of the ECB was transmitted effectively across the euro area, especially in a situation where financial markets were experiencing significant stress. In particular, the PEPP was designed to allow for fluctuations in the volume of purchases across time, asset classes and jurisdictions. This flexibility was key in addressing the specific transmission challenges posed by the pandemic, ensuring that the ECB’s monetary policy stance was felt uniformly across the euro area economy.
-
See Benetton, M. and Fantino, D. (2021), “Targeted monetary policy and bank lending behavior”, Journal of Financial Economics, Vol. 142, Issue 1, October 2021, pp. 404-429; Barbiero, F., Boucinha, M. and Burlon, L. (2021), “TLTRO III and bank lending conditions”, Economic Bulletin, Issue 6, ECB; and Altavilla, C., Canova, F. and Ciccarelli, M. (2020), “Mending the broken link: Heterogeneous bank lending rates and monetary policy pass-through”, Journal of Monetary Economics, Vol. 110(C), pp. 81-98.
-
See Rostagno, M., Altavilla, C., Carboni, G., Lemke, W., Motto, R., Saint Guilhem, A. and Yiangou, J. (2021), “Monetary policy in times of crisis: A tale of two decades of the European Central Bank”, Oxford University Press; Altavilla, C., Carboni, G. and Motto, R. (2015), “Asset purchase programmes and financial markets: lessons from the euro area”, Working Paper Series, No 1864, ECB; for Japan, see Bowman, D., Cai, F., Davies, S. and Kamin, S. (2015), “Quantitative easing and bank lending: Evidence from Japan”, Journal of International Money and Finance, Vol. 57, pp. 15-30; for the United States, see Rodnyansky, A. and Darmouni, O.M. (2017), “The Effects of Quantitative Easing on Bank Lending Behavior”, The Review of Financial Studies, Vol. 30, Issue 11, pp. 3858-3887; and for the United Kingdom, see Joyce, M. and Spaltro, M. (2014), “Quantitative easing and bank lending: a panel data approach”, Working Papers, No 504, Bank of England.
-
See D.Vayanos and J.-L. Vila (2021), “A Preferred-Habitat Model of the Term Structure of Interest Rates,” Econometrica 89(1), 77-112; and Fabian Eser & Wolfgang Lemke & Ken Nyholm & Sören Radde & Andreea Liliana Vladu, 2023. "Tracing the Impact of the ECB’s Asset Purchase Program on the Yield Curve”, International Journal of Central Banking, vol. 19(3), pages 359-422, August.
-
See Albertazzi, U., Becker, B. and Boucinha, M. (2021), “Portfolio rebalancing and the transmission of large-scale asset purchase programs: Evidence from the Euro area”, Journal of Financial Intermediation, Vol. 48, 100896.
-
See Adalid, R. and Palligkinis, S. (2016), “Sectoral Sales of Government Securities During the ECB’s Asset Purchase Programme”, SSRN; and Picón, C., Oliveira-Soares, R. and Adalid, R. (2020), “Revisiting the monetary presentation of the euro area balance of payments”, Occasional Paper Series, No 238, ECB.
-
This enhanced support led to a substantial take-up in TLTRO III operations, with banks borrowing a record €1.3 trillion in June 2020, which increased to €1.8 trillion by December 2020. Altogether, the volume of borrowing under the TLTROs in the euro area was notably larger than that of comparable programmes in the United States or the United Kingdom.
-
See Altavilla, C., Barbiero, F., Boucinha, M. and Burlon, L. (2023), “The Great Lockdown: Pandemic response policies and bank lending conditions”, European Economic Review, Vol. 156(C).
-
See Bańbura, M., Bobeica, E. and Martínez Hernández, C. (2023), “What drives core inflation? The role of supply shocks”, Working Paper Series, No 2875, ECB. The authors show that the increase in the inflation rate in the euro area since the onset of the pandemic was predominantly due to energy price shocks, food price shocks and supply chain disruptions. For the role of labour market dynamics, see also Bernanke, B. and Blanchard, O. (2023), “What Caused the U.S. Pandemic-Era Inflation?”, NBER Working Paper Series, No 31417, National Bureau of Economic Research; Arce, O., Ciccarelli, M., Kornprobst, A. and Montes-Galdón, C. (2024), “What caused the euro area post-pandemic inflation?”, Occasional Paper Series, No 343, ECB; and Menz, J.-O. (2024), “Sources of post-pandemic inflation in Germany and the euro area: An application of Bernanke and Blanchard (2023)”, Technical Paper, No 02/2024, Deutsche Bundesbank.
-
See also Deutsche Bundesbank (2023), “From the monetary pillar to the monetary and financial analysis”, Monthly Report, January; Broadbent, B. (2023), “Monetary policy: prices versus quantities”, speech by Ben Broadbent at the National Institute of Economic and Social Research, London, 25 April; and King, M.A. (2024), “Inflation Targets: Practice Ahead of Theory”, NBER Working Paper Series, No 32594, National Bureau of Economic Research.
-
Chart 7 also shows that the allocation of excess savings to housing investment was relatively minor.
-
For the planned allocation of household net savings in the next 12 months, see Dossche, M., Georgarakos, D., Kolndrekaj, A. and Tavares, F. (2022), “Household saving during the COVID-19 pandemic and implications for the recovery of consumption”, Economic Bulletin, Issue 5, ECB.
-
Of course, an increase in global demand (relative to constrained supply) played a part in the rise in energy and food prices.
-
This is a view shared with policymakers from other jurisdictions. Broadbent, B. (2023), “Monetary policy: prices versus quantities”, speech at the National Institute of Economic and Social Research, London, 25 April, also argues that those buffers could not account for the subsequent upside surprise in inflation.
-
For a comprehensive discussion of the tightening cycle, see Lane, P.R. (2022), “Monetary policy in the euro area: the next phase”, remarks for high-level panel “High Inflation and Other Challenges for Monetary Policy” by Philip R. Lane, Member of the Executive Board of the ECB, Annual Meeting 2022 of the Central Bank Research Association (CEBRA), Barcelona, 29 August; Lane, P.R. (2023), “The banking channel of monetary policy tightening in the euro area”, remarks by P.R. Lane, Member of the Executive Board of the ECB, at the Panel Discussion on Banking Solvency and Monetary Policy, NBER Summer Institute 2023 Macro, Money and Financial Frictions Workshop, 12 July; and Lane, P.R. (2024), “The analytics of the monetary policy tightening cycle”, guest lecture by Philip R. Lane at Stanford Graduate School of Business, Stanford, 2 May.
-
TLTRO III consists of ten operations with a maturity of three years, starting in September 2019 at quarterly frequency. When initially launched, the first seven TLTRO III operations could be voluntarily repaid after two years from the settlement of each operation. In March 2020 the early repayment option was adjusted to give counterparties the possibility to voluntarily repay funds already one year after settlement, starting in September 2021. Three more operations were introduced in December 2020, with an early repayment option at quarterly frequency starting in June 2022. On 27 October 2022 the ECB’s Governing Council announced a recalibration of all existing TLTRO III operations to ensure consistency with broader monetary policy normalisation process. From 23 November 2022 interest rates on all remaining TLTRO III operations were indexed to average applicable key ECB interest rates from that date onward, in practice increasing their price. Modifications were accompanied by three additional voluntary early repayment dates introduced for banks wishing to terminate or reduce borrowings before maturity. In response to the change in pricing conditions, large voluntary repayments were done in November and December 2022. Currently, only two operations are still outstanding for a total amount of €76.4 billion and they will be repaid in September and December 2024.
-
See Adalid, R., Lampe, M. and Scopel, S. (2023), “Monetary dynamics during the tightening cycle”, Economic Bulletin, Issue 8, ECB.
-
See Fricke, D., Greppmair, S., and Paludkiewicz, K. (2024), “Excess reserves and monetary policy tightening”, Deutsche Bundesbank Discussion Paper, no. 5.
-
When the interest rate paid on reserves was negative, this substitution effect constituted a “hot potato” mechanism by which individual banks sought to shed reserves by increasing lending or bond purchases. See E. Ryan and K. Whelan (2021), “Quantitative Easing and the Hot Potato Effect: Evidence from euro area banks,” Journal of International Money and Finance 115, 102354.
-
See Altavilla, C., Lemke, W., Linzert, T., Tapking, J. and von Landesberger, J. (2021), “Assessing the efficacy, efficiency and potential side effects of the ECB’s monetary policy instruments since 2014”, Occasional Paper Series, No 278, ECB, and Rostagno, M., Altavilla, C., Carboni, G., Lemke, W., Motto, R. and Saint Guilhem, A. (2021), “Combining negative rates, forward guidance and asset purchases: identification and impacts of the ECB’s unconventional policies”, Working Paper Series, No 2564, ECB.
-
See Ray, W., Droste, M. and Gorodnichenko, Y. (forthcoming), “Unbundling of Quantitative Easing: Taking a Cue from Treasury Auctions”, Journal of Political Economy.
-
For a contemporary definition and rehabilitation of the “money multiplier” theory of transmission, see Altavilla, C., Rostagno, M. and Schumacher. J. (2023), “Anchoring QT: Liquidity, credit and monetary policy implementation”, Discussion Paper, No 18581, Centre for Economic Policy Research.
-
A risk surrounding QT that has recently been emphasised is the possibility that the reserve balances created in QE times might have been hypothecated by banks writing off-balance-sheet claims on them, thus making the system vulnerable to a sustained loss of liquidity under QT. See recent work by Acharya, V.V. and Rajan, R. (2022), “Liquidity, liquidity everywhere, not a drop to use–Why flooding banks with central bank reserves may not expand liquidity”, NBER Working Paper Series, No 29680, National Bureau of Economic Research; and Acharya, V.V., Chauhan, R.S., Rajan, R. and Steffen, S. (2023), “Liquidity dependence and the waxing and waning of central bank balance sheets”, NBER Working Paper Series, No 31050, National Bureau of Economic Research. According to these studies, this phenomenon might explain the money market tensions observed in September 2019, as the amount of fed funds – being withdrawn from the system by the Federal Reserve in the context of its first phase of QT– dropped to a minimum threshold at which scarcity produced a generalised seizing up of transactions and a surge in money market interest rates.
-
See Altavilla, C., Rostagno, M. and Schumacher, J. (2023), “Anchoring QT: Liquidity, credit and monetary policy implementation”, Discussion Paper, No 18581, Centre for Economic Policy Research. This study does not examine the impact of reserves created by longer-term refinancing operations (such as the TLTRO programmes), which might be viewed as an intermediate case between the polar cases of liquidity created by asset purchase and liquidity created by short-term refinancing operations.
-
On (a), see Rodnyansky, A. and Darmouni, O.M. (2017), “The Effects of Quantitative Easing on Bank Lending Behavior”, The Review of Financial Studies, Vol. 30, Issue 11, pp. 3858-3887; Kandrac, J. and Schlusche, B. (2021), “Quantitative Easing and Bank Risk Taking: Evidence from Lending”, Journal of Money, Credit and Banking, Vol. 53(4), pp. 635-676; on (b), see Acharya, V.V. and Rajan, R. (2022), “Liquidity, liquidity everywhere, not a drop to use–Why flooding banks with central bank reserves may not expand liquidity”, NBER Working Paper Series, No 29680, National Bureau of Economic Research, and Acharya, V.V., Chauhan, R.S., Rajan, R. and Steffen, S. (2023), “Liquidity dependence and the waxing and waning of central bank balance sheets”, NBER Working Paper Series, No 31050, National Bureau of Economic Research; on (c), see Altavilla, C., Boucinha, M., Burlon, L., Giannetti, M. and Schumacher, J. (2022), “Money markets and bank lending: evidence from the adoption of tiering”, Working Paper Series, No 2649, ECB; on (d), see Fricke, D., Greppmair, S. and Paludkiewicz, K. (2023), “Excess Reserves and Monetary Policy Tightening”, SSRN.
European Central Bank
Directorate General Communications
- Sonnemannstrasse 20
- 60314 Frankfurt am Main, Germany
- +49 69 1344 7455
- media@ecb.europa.eu
Reproduction is permitted provided that the source is acknowledged.
Media contacts