Forecast processes and methodologies: results of the 2023 special survey - Survey conducted on the occasion of the 25th anniversary of the ECB SPF
To mark the 25th anniversary of the ECB Survey of Professional Forecasters (SPF), a special survey was conducted in 2023 to explore the processes and methodologies underlying participants' forecasts. Participants were sent this fourth special survey on SPF forecast processes and methodologies in the fourth quarter of 2023 (after 100 rounds of the SPF and 25 years on from its inception in the first quarter of 1999).[1] This paper outlines the main findings and conclusions from the survey.
The 2023 survey contained similar questions to those asked in previous special surveys, along with new questions addressing issues specific to the past five years. The questions repeated from the previous special surveys covered the use of economic models, the role of judgement and the relationship between different variables (such as inflation and activity, or growth and employment). The specific questions related to the pandemic, geopolitical developments (in particular Russia’s war in Ukraine), extreme weather and climate change, and the period of high inflation in the euro area (from August 2021 to September 2023).[2]
Main findings and conclusions
- On the question of the frequency of forecast variables, for shorter and medium-term horizons, respondents said they mostly forecast the variables at the frequency at which they are released (an exception is the unemployment rate). At longer-term horizons, most forecasts are annual (although some are quarterly).
- On the question of assumptions, respondents indicated that they mostly base their oil price expectations on market futures prices, while their USD/EUR exchange rate expectations are based on an average of recent prices or on model output and judgement, and their interest rate assumptions are based mainly on model output and judgement or judgement alone.
- Respondents indicated that oil price shocks would have a significant impact on inflation and growth forecasts for two years but would then largely fade away, although the magnitude of the impact would depend crucially on the nature of the shock (for instance, whether driven by demand or supply shocks). Exchange rate shocks (USD/EUR) would also have significant (but largely temporary) impacts on inflation and growth forecasts.
- On the question of the use of models and the role of judgement, most respondents indicated that shorter and more medium-term point forecasts for inflation and GDP growth are either essentially model-based or model-based with judgement adjustments, while the role of expert judgement increases with horizon length (and also plays a more important role for unemployment rate and wage growth forecasts). In contrast to point forecasts, expectations for probability distributions are predominantly judgement-based. Over time, there has been little change, although the role of judgement in making point forecasts has increased for longer-term horizons.
- Respondents use a variety of different models to inform point forecasts across variables and horizons (although reduced-form models continue to dominate), while the use of machine learning techniques remains limited. Models with an economic structure are used more regularly for producing longer-term forecasts.
- Respondents tend not to use a single comprehensive model specification, but typically combine models. This is to reflect the various comparative advantages across economic variables and horizons and (to a lesser extent) to allow results to be cross-checked.
- While respondents frequently consider the economic relationships between variables, such as Okun’s law or the Phillips curve, this is mainly done informally and more for the medium-term than for the shorter or longer-term. There are also indications that these relationships may have been used less for forecasting purposes during recent turbulent times. In addition, the relationships are generally used less for probability distribution forecasts.
- The share of respondents reporting that their forecast models allow for non-linearities has increased strongly (from around 30% in previous special surveys to around 60% in this survey). A majority also indicated that the pandemic and recent inflation surge had caused them to change their forecast models or long-term forecasts. In addition, many respondents said that (country) bottom-up forecasting had become more important, although (aggregate euro area) top-down forecasting remained dominant.
- Almost half of respondents noted that the green transition, demographic developments and Russia’s war in Ukraine had caused them to change their models or long-term forecasts. Between 20% and 30% indicated that climate change or extreme weather, other geopolitical factors (not related to Russia’s invasion of Ukraine) and the ECB’s monetary policy strategy review had also had an impact on their models or long-term forecasts.
- When forming their longer-term inflation expectations (five years ahead), respondents use a wide range of information. The ECB’s inflation target is mentioned most often, followed by trends in actual inflation, forecasts reported in other surveys, longer-term inflation expectations from financial markets and trends in wages. Compared with previous surveys, the use of other survey-based forecasts increased the most, while the importance of actual inflation trends and the ECB’s inflation target also increased.
- Most respondents noted that the five-year horizon was sufficiently long to be considered a “steady state” and that extending the horizon (for example to ten years) would generally have little impact. However, some respondents indicated that it could have a marginal impact on longer-term growth and unemployment rate forecasts (owing to demographics or structural productivity and labour market developments).
- While most respondents indicated the mean (of their reported probability distributions) as the reference for their point forecasts, the percentage citing the modal or median value (or indicating that the value used as the reference can vary) has increased over time.
- Approximately two-thirds of respondents reported that they regularly evaluate the accuracy of their point forecasts – particularly those for HICP inflation and GDP growth. Three-quarters of respondents reported a noteworthy change (deterioration) in the accuracy of their point forecasts since 2020. Participants reported that they responded to forecast accuracy evaluations in different ways. The most common (single) response was to adjust the judgement used in their forecasts, but model-based approaches were most common overall.
2 Survey results
2.1 Forecast processes
2.1.1 Frequency at which variables and horizons are forecast (Q1.1)
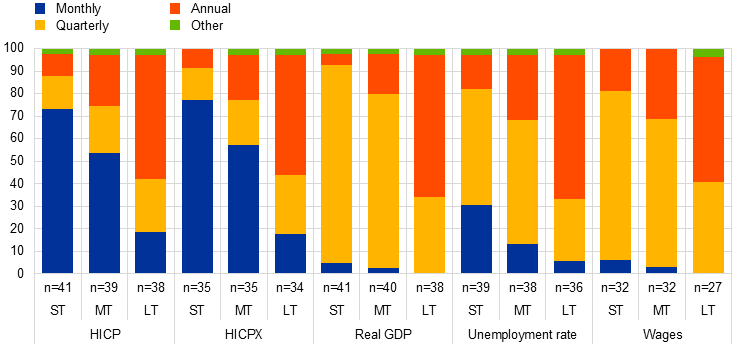
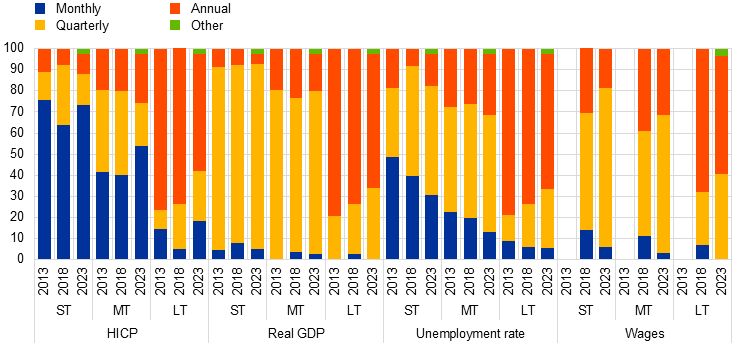
The highest frequency at which SPF forecasts are made varies across variables and horizons (short-term, medium-term and long-term) (Chart 1).[3]
Chart 1
What is the highest frequency at which each variable is forecast?
(percentages of responses)
Sources: ECB SPF and staff calculations.
Notes: The numbers along the x-axis are the numbers of respondents who provided an explicit response to each question. The total number of respondents was 41. ST = shorter-term; MT = more medium-term; LT = longer-term.
On the question of HICP and HICPX inflation, most respondents indicated that they forecast monthly outcomes for the shorter and more medium-term horizons. This matches the frequency at which official HICP inflation data are made available. For the longer-term horizon (four to five years ahead), the response given most often was “annual”.
On the question of real GDP growth forecasts, the answer given most often for the shorter and more medium-term horizons was “quarterly” – again matching the frequency at which official GDP data are made available. For longer-term horizons, two-thirds reported forecasting annual GDP and one-third reported that they forecast quarterly GDP.
On the question of unemployment rate forecasts, the answer given most often for the shorter and more medium-term horizons (cited by just over 50% of respondents) was “quarterly”. This is despite the fact that official unemployment data are made available at a monthly frequency. For longer-term horizons, two-thirds of respondents reported that they forecast the annual unemployment rate.
On the question of labour cost assumptions (whole economy compensation per employee), most respondents (three-quarters and two-thirds respectively) reported quarterly forecasts for the shorter and more medium-term horizons. Again, for longer-term horizons, the answer given most often was “annual” (although 40% of respondents reported quarterly forecasts).
There were few changes compared with previous special questionnaires (Chart A1.1 in Annex 1). Since 2013 and 2018, the share of monthly forecasts of inflation has increased slightly at the more medium and longer-term horizons. Meanwhile, the share of monthly forecasts for the unemployment rate has decreased at all horizons. Overall, however, the pattern across variables and horizons is broadly unchanged. Some respondents commented that they only produce longer-term forecasts for the ECB SPF.
2.1.2 Formation of assumptions (Q1.11)
Chart 2
How do you form your expectations for other variables?
(percentages of responses)
Sources: ECB SPF and staff calculations.
Notes: A total of 39 respondents answered the question. Respondents were able to select multiple answers, so the percentages do not necessarily add up to 100.
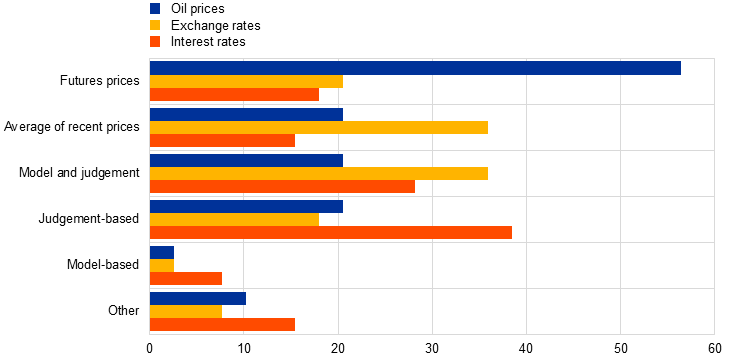
The regular quarterly SPF also asks respondents to give their expectations for the oil price (in US dollars), the EUR/USD exchange rate and the ECB’s interest rate on main refinancing operations (MRO). Respondents reported that they formed these expectations in a variety of ways (Chart 2). Oil prices were typically expected to follow the path implied by financial market futures prices (56%, up slightly from 53% in 2018), whereas the use of model output, expert judgement and, in particular, averages of recent prices all decreased. Exchange rate expectations were generally based on either the average of recent prices (36%) or a combination of model output and expert judgement (36%), similarly to 2018. By contrast, the use of pure judgement has decreased. Expectations for the MRO tended to be more judgement-based (38%), while the use of models and recent averages has declined since 2018. When asked about preferred indicators, all respondents reported that Brent crude was their preferred oil price benchmark. For labour costs, 73% preferred compensation per employee for the whole economy, although some respondents reported using compensation per hour, the labour cost index or negotiated wages. Additionally, 57% of respondents indicated that they estimate or forecast measures of economic slack (i.e. output or unemployment gap).
2.1.3 Response to oil price and exchange rate shocks (Q1.5)
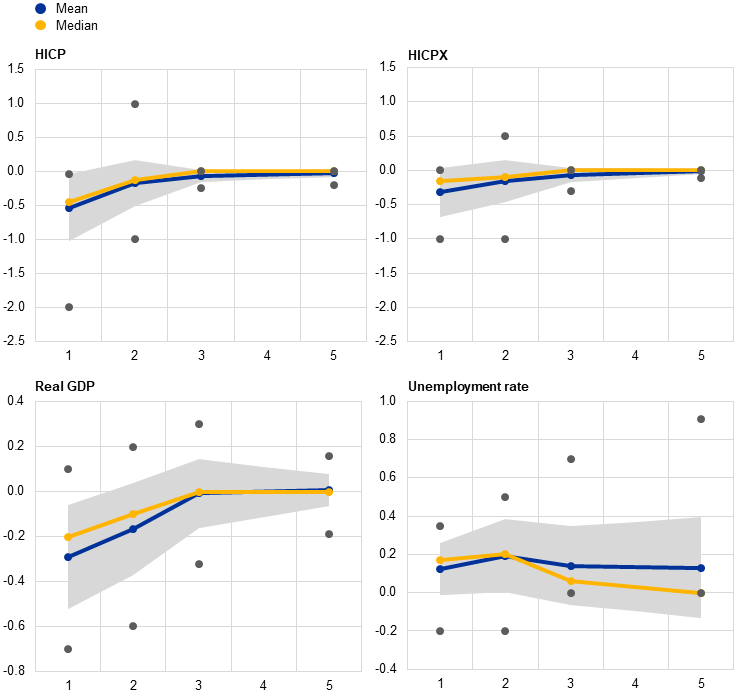
Oil price shocks and USD/EUR exchange rate shocks have a significant (but largely temporary) impact on inflation and growth forecasts. Respondents indicated that a permanent 10% oil price increase would significantly affect forecasts for inflation (positive effect) and GDP growth (negative effect) for two years, with the impact generally fading after three years (Chart 3). The profile of the “impulse response function” of the unemployment rate (positive effect) was different, given that unemployment is a level rather than a rate of change series: oil price shocks would have a more prolonged impact on the unemployment rate forecast, although most of this impact would occur in the first year. Around a quarter of respondents indicated that they allowed for level-dependent elasticities in the response to oil price shocks.[4]
Chart 3
What impact would a 10% increase in oil prices (in US dollars) have on forecasts?
(y-axis - percentage points; x-axis – forecast horizon in years)
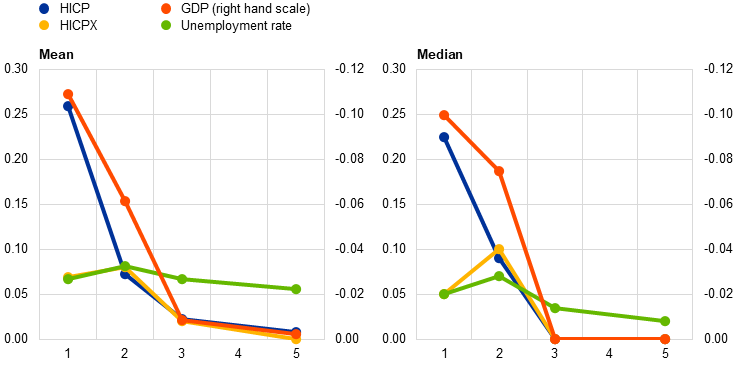
Sources: ECB SPF and staff calculations.
Notes: Respondents were asked: “If your expected path for the oil price over your forecast horizon were suddenly to increase by 10% (and this shock were assumed to be permanent), what would be the approximate impact on your forecasts?” A total of 26 responses were received for HICP inflation, 23 for HICPX inflation, 20 for real GDP growth and 14 for the unemployment rate (URX).
Similarly, respondents indicated that, on average, a permanent change in the USD/EUR exchange rate would have a significant, albeit relatively short-lived, impact on inflation and growth. An upward exchange rate shock was expected to affect both inflation and growth negatively (Chart 4). However, there was considerable heterogeneity in the responses reported, and respondents indicated that the nature of the shocks (demand side, supply side, financial or other) mattered greatly for the estimated impact (in terms of magnitude and even direction). Chart A2.1 and Chart A2.2 in Annex 2 show details of the estimated “impulse response functions” (including the one standard deviation range and the minimum and maximum estimated impact).
Chart 4
What impact would a 10% increase in the EUR/USD exchange rate have on forecasts?
(y-axis - percentage points; x-axis – forecast horizon in years)
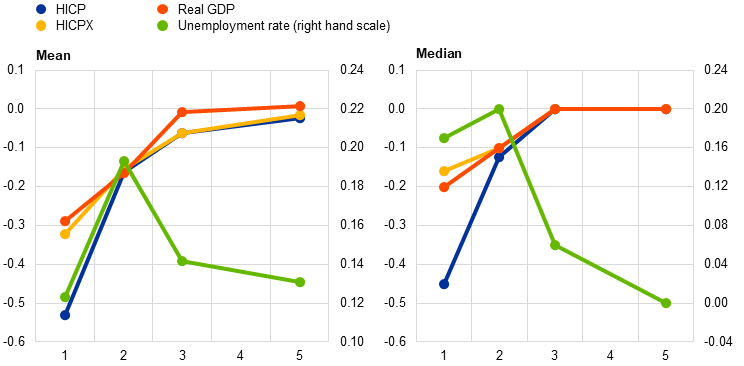
Sources: ECB SPF and staff calculations.
Notes: Respondents were asked: “If your expected path for the EUR/USD exchange rate over your forecast horizon were suddenly to increase by 10% (and this shock were assumed to be permanent), what would be the approximate impact on your forecasts?” A total of 22 responses were received for HICP inflation, 15 for HICPX inflation, 19 for real GDP growth and 13 for the unemployment rate (URX).
2.2 Forecast models and the role of judgement
2.2.1 Model versus judgement (Q1.2)
Expert judgement plays an important role in point forecasts, particularly for longer-term horizons. While a small percentage of point forecasts are essentially model-based (the highest portion is 24% for shorter-term inflation forecasts), most point forecasts are model-based with judgement adjustments (on average 60% across different variables and horizons) (Chart 5). The role of expert judgement increases for longer-term horizons (averaging 60% across variables compared with 30% for shorter-term horizons). Judgement also plays a more important role in unemployment rate (50%) and wage growth (50%) forecasts than in inflation (30%) and GDP growth (40%) forecasts.
Chart 5
To what extent are your point forecasts model or judgement-based?
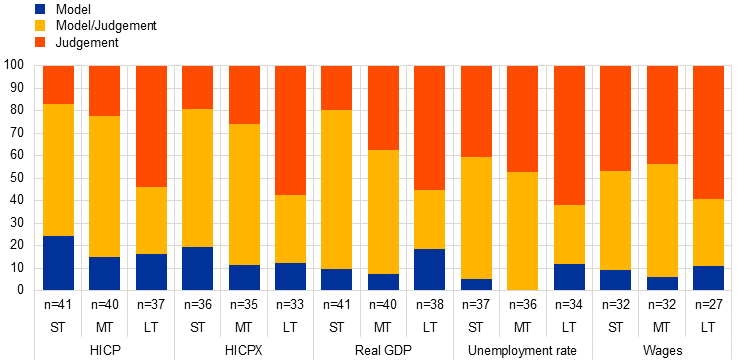
Sources: ECB SPF and staff calculations.
Notes: The numbers along the x-axis are the numbers of respondents who provided an explicit response to the question. The total number of respondents was 41. ST = shorter-term; MT = more medium-term; LT = longer-term.
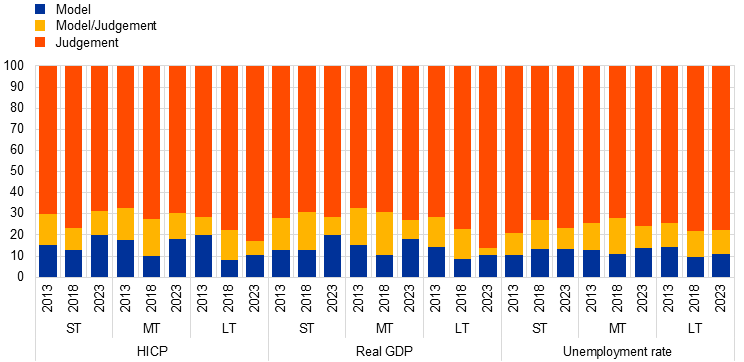
Forecasts for expected probability distributions are mainly judgement-based. Compared with 40% for point forecasts (on average across variables and horizons), over 75% of probability distribution forecasts are reported to be essentially based on judgement (Chart 6). Here again, judgement is more likely to be used for longer-term horizons (85%) than for shorter or more medium-term ones (74%). There is little variation across variables in the propensity to use judgement for probability distributions.
Chart 6
To what extent are your reported probability distributions model or judgement-based?
(percentages of responses)
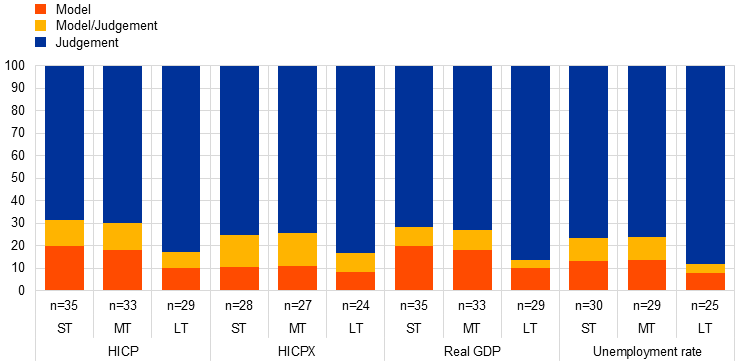
Sources: ECB SPF and staff calculations.
Notes: The numbers along the x-axis are the numbers of respondents who provided an explicit response to the question. The total number of respondents was 41. ST = shorter-term; MT = more medium-term; LT = longer-term.
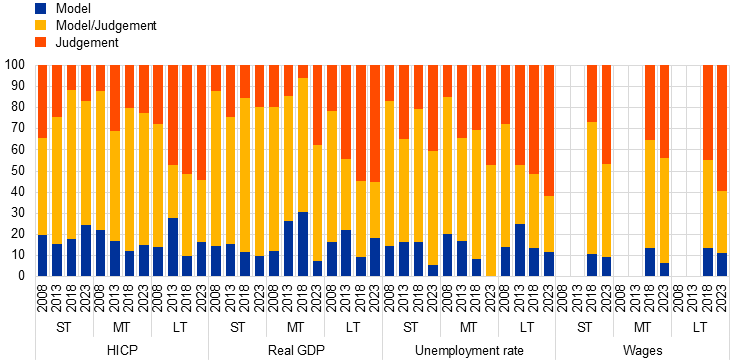
While there has been little change over time, the role of judgement in point forecasts has increased for longer-term horizons (Chart A1.2 in Annex 1). Comparing the four special surveys (2008, 2013, 2018 and 2023), the same broad pattern has held over time across variables and horizons. However, there are two noteworthy patterns. First, there has been a reported increase in the role of judgement in longer-term point forecasts for the individual variables. A second, more subtle pattern is that judgement is reported to play a larger role for the short and medium-term horizons in the 2013 and 2023 surveys. This may be due to the periods of economic volatility that preceded these surveys (global financial crisis and pandemic). Meanwhile, probability distribution forecasts continue to be mostly judgement-based (75% on average) (Chart A1.3 in Annex 1).
2.2.2 Types of models used (Q1.3)
While SPF respondents employ a variety of models, the use of machine learning techniques remains limited. Reduced-form models, in particular single equation models, are still the most common choice for forecasting HICP, HIPCX, GDP, unemployment and wages. Models with an economic structure are used more regularly for producing longer-term forecasts. Structural or semi-structural models are used by less than 30% of respondents (Chart 7). More than 70% of respondents suggested that novel methodologies (such as artificial intelligence, machine learning, big data and web-scraping) were not used consistently, and if they were, it was mostly to extract a near-term signal or produce a short-term forecast.
Chart 7
If you use models for forecasting, which type(s) do you use?
(percentages of responses)
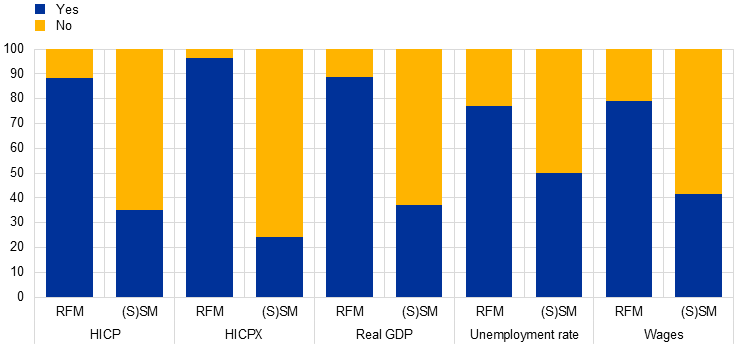
Sources: ECB SPF and staff calculations.
Notes: Respondents were offered various forecasting techniques to select, such as autoregressive integrated moving average (ARIMA) models, factor models and vector autoregression (VAR) models for reduced-form models, as well as dynamic stochastic general equilibrium (DSGE) models and large-scale semi-structural specifications (FRB/US model). A total of 35 responses were received. RFM = reduced-form model; (S)SM = structural or semi-structural model.
2.2.3 Single models versus model combination (Q1.4)
Most respondents (83%) typically employ several models instead of using a single comprehensive specification. Those who said they combined models indicated that they did so because of the comparative advantages offered by different models at different horizons (59%) or for different economic variables (76%) (Chart 8). Compared with the 2018 survey, a slightly smaller percentage of respondents said they used multiple models in order to cross-check results. Findings from cross-checks were mostly used to inform the judgement applied to the main forecasting specification.
Chart 8
If you use different types of models, what is your reason for doing so?
(percentages of responses)
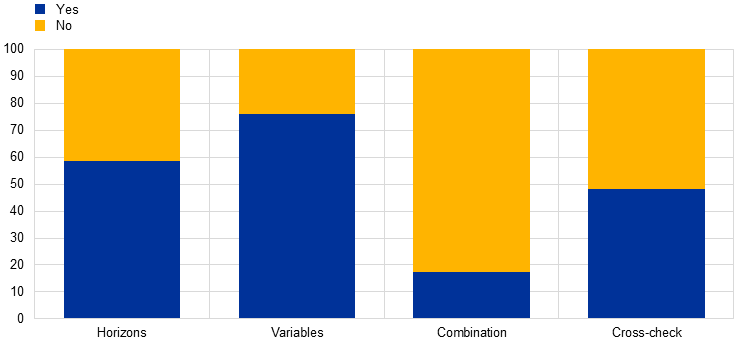
Sources: ECB SPF and staff calculations.
Notes: Respondents were asked: “Do you use one encompassing model for all variables/horizons or different models depending on variable/horizon?”. If they indicated yes, they were then asked: “If you use different types of models, what is your reason for doing so?” A total of 29 responses were received.
Top-down euro area forecasts remain the most common approach, but an increasing share of respondents use a combination of top-down and bottom-up forecasts. Most respondents construct their euro area forecast directly as an aggregate (42%), thus taking a top-down approach. A bottom-up approach (aggregating country forecasts) is rarely used on its own (18%) but is frequently adopted as part of a cross-checking process: 40% of respondents indicated that they combined the two approaches (Chart 9). Relative to the 2018 survey, fewer respondents construct forecasts using only a top-down approach, while more respondents use both approaches simultaneously, possibly emphasising the increasing importance of bottom-up methodologies (as also signalled in the responses to some of the subsequent questions).
Chart 9
How do you construct your forecasts for the euro area?
(percentages of responses)
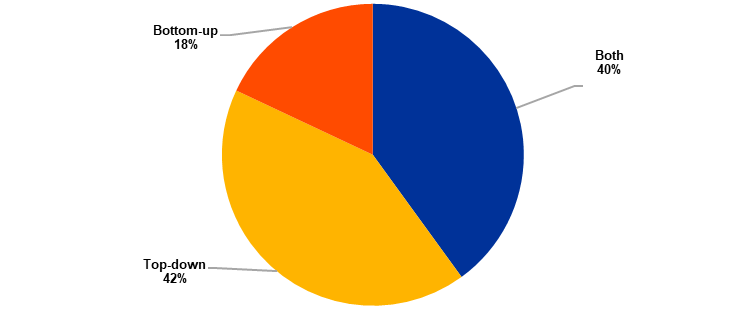
Sources: ECB SPF and staff calculations.
Note: A total 38 responses were received.
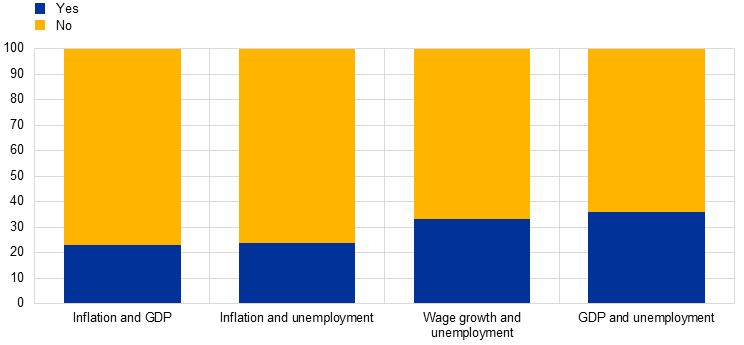
2.2.4 Relationship between forecasts of different variables (Q1.7 and Q1.8)
When creating point forecasts, respondents frequently consider the economic relationships between variables, such as the Phillips curve or Okun’s law. As in the 2018 special survey, most respondents indicated that, across four pairs of variables, their point forecasts were jointly determined (Chart 10). This was mainly done informally, for example through judgements applied to model outputs. However, the share of respondents who determine their point forecasts jointly for pairs of variables declined slightly compared with 2018. This might reflect the challenges using standard macroeconomic relationships to provide forecasts in turbulent times.
Chart 10
Are your point forecasts for the following pairs of variables jointly determined?
(percentages of responses)
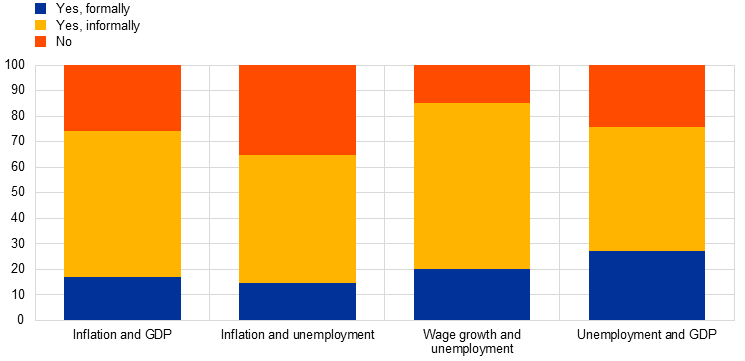
Sources: ECB SPF and staff calculations.
Note: A total of 35 responses were received.
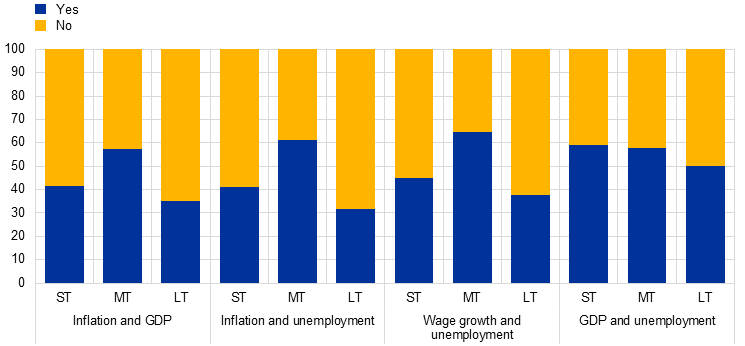
A majority of respondents reported changes in the Phillips curve relationship since 2020, while a smaller percentage reported changes in Okun’s law (Chart 11). Relationships between variables were seen as most relevant when updating point forecasts at more medium-term horizons, as less relevant for shorter-term horizons and as least relevant for longer-term horizons (Chart 12).
Chart 11
Have there been changes in the Phillips curve and Okun’s law since 2020?
(percentages of responses)
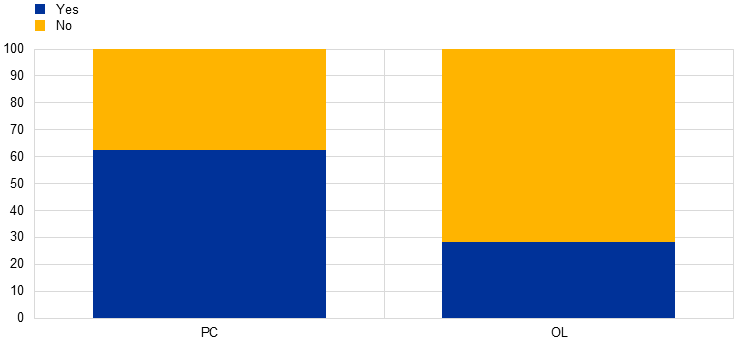
Sources: ECB SPF and staff calculations.
Notes: Responses were received from 24 respondents. PC = Phillips curve; OL = Okun’s law.
Chart 12
Are updates to your point forecasts for the following pairs of variables dependent on one another?
(percentages of responses)
Sources: ECB SPF and staff calculations.
Notes: A total of 36 responses were received. ST = short-term; MT = medium-term; LT = long-term.
In contrast to the strong evidence indicating that point forecasts are determined jointly by pairs of variables, economic relationships between variables play less of a role for probability distributions (Chart 13). Significantly fewer respondents indicated that their probability distributions were jointly determined by the four pairs of variables, or that the distributions had evolved in a way that made the variables dependent on one another. Focusing on Okun’s law, while more than 60% of the participants signalled that their point forecasts of GDP and unemployment are jointly determined, only 40% gave this response for probability distributions. On the question of the Phillips’ curve relationship, more than half of respondents jointly determine their inflation and unemployment point forecasts, while only 24% do so for their respective probability distributions. Similarly to point forecasts, the joint determination of probability distributions was reported to be most relevant at more medium-term horizons (Chart 14).
Chart 13
Are your probability distributions for the following pairs of variables jointly determined?
(percentages of responses)
Sources: ECB SPF and staff calculations.
Note: A total of 26 responses were received.
Chart 14
Are updates to your probability distributions for the following pairs of variables dependent on one another?
(percentages of responses)
Sources: ECB SPF and staff calculations.
Notes: A total of 25 responses were received. ST = shorter-term; MT = more medium-term; LT = longer-term.
2.3 Impact of structural developments and determinants of longer-term inflation expectations
2.3.1 Impact of structural changes in economic relationships on forecasts (Q1.6)
Structural changes and recent developments have had an impact on forecast models and longer-term expectations. In response to a question on the impact of structural changes in economic relationships on forecasts, 57% of respondents noted that their forecast models allowed for non-linearities (for instance by incorporating structural breaks or utilising time-varying parameters) (Chart 15). This represents a strong increase from the share of around one-third reported in both the 2013 and 2018 special surveys. The increase is probably due to the multitude and size of economic shocks that have occurred in the past five years. Among respondents who allow for non-linearities, three out of four do so using judgement, with the rest equally split between model-based approaches and a mix of model and judgement.
Chart 15
Do your forecasts allow for non-linearities, e.g. structural breaks or time-varying parameters?
(percentages of responses across the past three SPF special survey rounds)
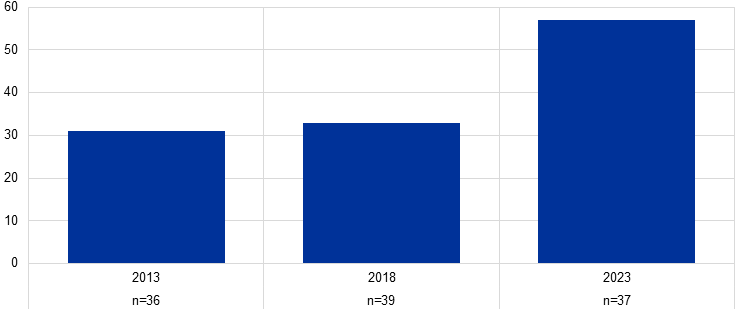
Sources: ECB SPF and staff calculations.
Note: The numbers below the x-axis indicate the overall number of respondents answering the question in the respective year.
Additionally, around 60% of respondents reported that the pandemic and recent inflation surge had each caused them to change their forecast models or long-term forecasts (Chart 16). According to qualitative comments, the inflation surge led many respondents to revise their inflation and interest rate expectations upwards and use more judgement in their forecasts. Most respondents (77%) also reported that since the inflation surge, some indicators had become more or less reliable signals of inflation. They noted the increased reliability of inflation expectations, supply chain factors, producer prices, import prices, energy (especially gas) and other commodity prices, and temperatures. Meanwhile, they reported reduced reliability of slack measures, wages, oil prices, and seasonality of travel and recreation. Additionally, 65% of respondents agreed that the relationship between inflation and other macroeconomic variables had changed, predominantly in the short run, citing reduced elasticities of macro variables (for example consumption) to inflation, increased pass-through of inflation to wages, the more important role played by headline inflation in inflation expectations and outcomes, and new factors such as sectoral shifts. The relative importance of top-down approaches compared with bottom-up approaches to forecasting euro area inflation has changed for 41% of respondents, with bottom-up approaches now seen as more important owing to larger country-specific components (for instance exposure and fiscal responses to the energy crisis, and to gas and electricity prices). For 30-50% of respondents, the green transition, demographic developments and Russia’s war in Ukraine had caused changes in forecast models or long-term forecasts. Meanwhile, 20-30% reported that other geopolitical factors, climate change or extreme weather events, and the strategy review had made an impact on forecasts. Comments showed that respondents increased their long-term inflation expectations in response to the green transition (for instance owing to changes in taxes and investment), demographic changes and geopolitics (for instance owing to changes in supply chains, financial/ economic integration and energy prices). The multiplication of shocks through climate change and geopolitical tensions was considered to have increased uncertainty and volatility.
Chart 16
Impact of specific events and developments on forecasts
(percentages of responses)
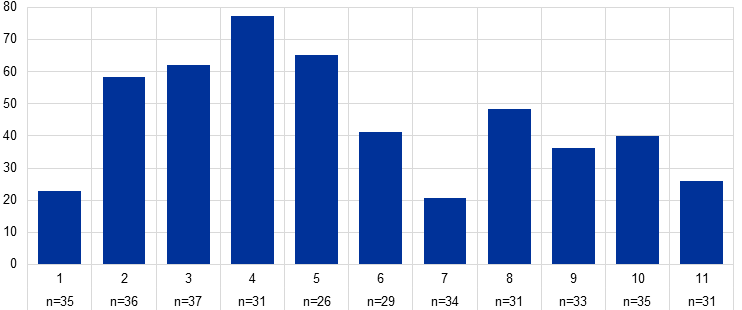
Sources: ECB SPF and staff calculations.
Notes: The numbers below the x-axis indicate the overall numbers of respondents answering each question. Respondents were able to select multiple answers, so the percentages do not necessarily add up to 100. The possible answers were as follows: 1) Strategy review changed forecast models/longer-term forecasts; 2) Pandemic changed forecast models/longer-term forecasts; 3) Inflation surge changed forecast models/longer-term forecasts; 4) Since inflation surge, some indicators provide more/less reliable signals on inflation; 5) Since inflation surge, relationship inflation/macro variables changed; 6) Since inflation surge, importance of top-down vs bottom-up approach to euro area inflation changed; 7) Climate change/extreme weather changed forecast models/longer-term forecasts; 8) Green transition changed forecast models/longer-term forecasts; 9) Demographic developments changed forecast models/longer-term forecasts; 10) Russia’s war in Ukraine changed forecast models/longer-term forecasts; 11) Other geopolitics changed forecast models/longer-term forecasts.
2.3.2 Determinants of longer-term inflation expectations (Q1.2, Q1.3, Q1.4, Q1.7 and Q1.8)
When forming their longer-term inflation expectations (five years ahead), respondents tend to use a wide range of information (Chart 17). The ECB’s inflation target is mentioned most often (86%), followed by trends in actual inflation (65%), forecasts reported in other surveys (57%), longer-term inflation expectations from financial markets (46%) and trends in wages (38%). The relative weighting of these different factors in forming expectations broadly mirrored this pattern, with the ECB’s inflation target weighted most strongly (38% on average), followed by actual inflation (19%), other survey-based forecasts, financial market indicators and wages (each around 10%). Compared with 2013 and 2018, the use of other survey-based forecasts increased by almost 20 percentage points, while actual inflation trends and the ECB’s inflation target have gradually grown in importance over the years.
Chart 17
Which of the following information do you typically use to form your longer-term inflation expectations (five years ahead)?
(percentages of responses)

Sources: ECB SPF and staff calculations.
Notes: The numbers next to the survey years indicate the overall number of respondents answering the question in the respective year. Respondents were able to select multiple answers, so the percentages do not necessarily add up to 100. The possible answers were as follows: 1) Long-term inflation expectations reported in other surveys; 2) Long-term inflation expectations from financial markets; 3) Trends in actual inflation; 4) Trends in monetary aggregates; 5) Trends in wages; 6) Fiscal variables (e.g. debt-to-GDP ratios); 7) The ECB’s inflation target; 8) Others.
2.4 Interpretation and evaluation
2.4.1 How long is the long run? (Q1.9)
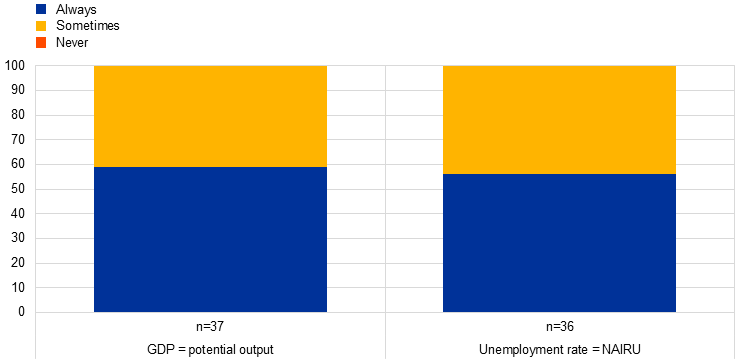
On the question of longer-term forecasts provided for real GDP growth (five years ahead), close to 60% of respondents indicated that these could be interpreted as their estimates for potential output growth. A similar percentage said their longer-term forecasts could be interpreted as their estimates for the non-accelerating inflation rate of unemployment (NAIRU) (Chart 18). In both cases, the percentage is up from around 40% in the 2018 special survey. Around 40% of respondents indicated that their longer-term forecasts sometimes corresponded to structural parameters, but the possibility that some shocks may persist for five years had not been ruled out. In contrast to 2018, no respondents stated that their long-term forecasts could not be interpreted at all as either potential output or NAIRU.
Chart 18
Interpretation of longer-term forecasts of real GDP growth and the unemployment rate
(percentages of responses)
Sources: ECB SPF and staff calculations.
Notes: The numbers along the x-axis are the numbers of respondents who provided an explicit response to the question. The total number of respondents was 41. The question asked was: “Can your longer-term forecasts of real GDP growth and the unemployment rate be interpreted, respectively, as your estimates of potential output growth and a structural unemployment rate (e.g. the NAIRU) at that horizon?”
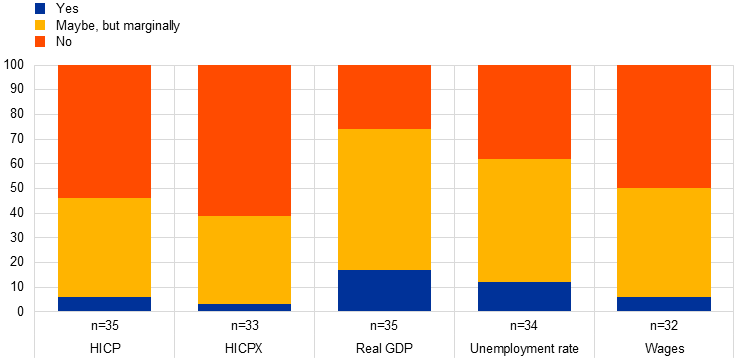
Respondents were also asked if their expectations for various variables would be different over even longer-term horizons (e.g. ten years ahead) compared with the longer-term expectations currently reported (five years ahead). In response, very few reported that expectations would be substantially different for HICP, HICPX or wages (Chart 19). A slightly larger proportion said they would be different for real GDP and unemployment, but as indicated in qualitative comments, this may be related to expected changes in trend growth (e.g. depending on developments in productivity or demographics).
Chart 19
Would expectations be different over ten years than over five years?
(percentages of responses)
Sources: ECB SPF and staff calculations.
Note: The numbers below the x-axis indicate the overall numbers of respondents answering each question.
2.4.2 Measures of central tendency (Q1.10)
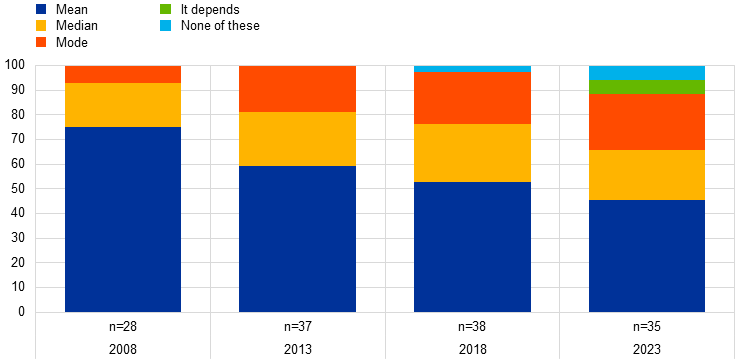
Most respondents indicated that they report the mean as their point forecasts, but the share reporting the modal value has increased. SPF respondents are not instructed as to which measure they should provide when reporting their point forecasts. Conceptually, whether they choose to report the mean of all probabilities, the most likely (or modal) outcome or the median is an open issue.[5] For 46% of special survey respondents, point forecasts refer to the mean of the probability distribution they report in the SPF, while for 23% these forecasts refer to the mode, and for 20% they refer to the median (Chart 20). The reporting of the mean has declined considerably over time, down from 75% in 2008, whereas the reporting of the median and particularly the mode has increased.
Chart 20
What do your reported point forecasts refer to?
(percentages of responses)
Sources: ECB SPF and staff calculations.
Note: The numbers below the x-axis indicate the overall numbers of respondents answering each question.
2.4.3 What is behind the increase in reported forecast uncertainty? (Q1.15)
When asked about the possible factors behind the observed increase in forecast uncertainty in the SPF, most respondents said they considered increased actual uncertainty to be the main explanation. A smaller percentage of respondents cited a more accurate assessment of uncertainty as the reason.[6] Forecast uncertainty as measured by the standard deviation of the aggregate probability distributions has increased in the period since 2020 across most variables and horizons in the SPF. This implies a further rise in uncertainty following the increase between the pre- and post-global financial crisis periods. Considering recent developments, respondents noted the unprecedented nature of the pandemic shock (on economic activity and on supply chains) as well as the fallout from Russia’s invasion of Ukraine. Around 10% of respondents noted that the increase in uncertainty was partly due to the fact that shocks had been mainly on the supply side. A similar portion of respondents noted that the increase in actual uncertainty had resulted in more attention to, and a better assessment of, the degree of uncertainty prevailing over the forecast horizon.
Most respondents (80%) indicated that the heightened uncertainty had not increased the influence of peers’ forecasts on their own forecasts.[7] Only a handful indicated that the forecasts of others were more likely to influence their forecasts given increased uncertainty, while a couple of respondents indicated the opposite.
2.4.4 Self-evaluation (Q1.12-13)
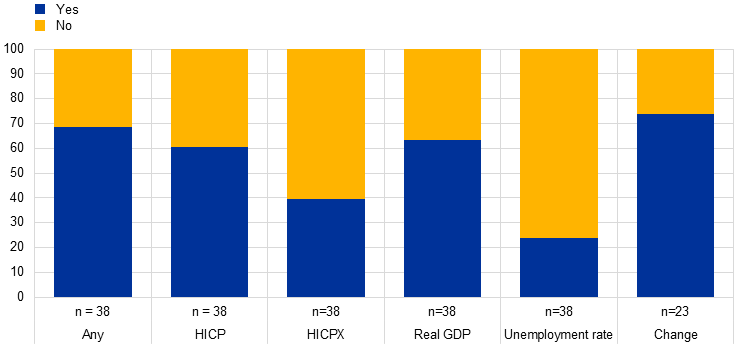
Approximately two-thirds of respondents reported that they routinely evaluate the accuracy of their point forecasts – particularly those for HICP inflation and GDP growth (Chart 21). Formal evaluations of point forecast accuracy are conducted more for HICP inflation and GDP growth than for HICPX inflation and the unemployment rate. Forecast evaluations were most commonly conducted quarterly (44%) or annually (30%). However, in 10% of cases they were conducted monthly, while the remainder of respondents said they carried them out according to an alternative cycle (semi-annual, ad hoc or continuous). The share of respondents conducting routine evaluations of their point forecasts has decreased slightly since 2013 and 2018. Some of the respondents who reported not conducting regular evaluations noted that they were nevertheless aware of their forecast performance, even if they did not formally track it. Similarly to 2018, when very few respondents reported that they routinely evaluated the accuracy of their probability distribution, only two respondents did so in this survey.
Chart 21
Do you routinely evaluate the accuracy of your point forecasts?
(percentages of responses)
Sources: ECB SPF and staff calculations.
Notes: The numbers along the x-axis are the numbers of respondents who provided an explicit response to the question. The total number of respondents was 41. URX = unemployment rate.
Three-quarters of respondents reported a noteworthy change in the accuracy of their point forecasts since 2020 (see last column of Chart 21). In their qualitative comments, respondents highlighted historically large errors for growth (particularly during the initial 2020-21 phase of the pandemic with the large contraction and subsequent rebound in economic activity) and inflation (owing to the pandemic and geopolitics). However, they also that these had already improved to a large degree as conditions normalised. One respondent noted that, despite the challenging economic environment, the unemployment rate had tended to come out lower than forecast.
Respondents indicated that they took different approaches towards responding to forecast accuracy evaluations. The most common (single) response was to adjust the judgement in their forecasts, but model-based approaches were most common overall. Model-based approaches include, where necessary, re-estimating model parameters (for instance over a different period), re-specifying models in terms of additional variables, modifying non-linearities, altering the degree of judgement, and/ or refreshing the set of tools used to inform judgements. Around one-third of respondents indicated that they followed more than one of these (judgement and model-based) approaches.
Annexes
Annex 1 – Comparisons with previous special surveys
Chart A1.1
What is the highest frequency at which variables are forecast?
(percentages of responses)
Sources: ECB SPF and staff calculations.
Notes: The question about wage forecasts was not asked in 2013. ST = shorter-term; MT = more medium-term; LT = longer-term.
Chart A1.2
To what extent are your point forecasts model or judgement-based?
(percentages of responses)
Sources: ECB SPF and staff calculations.
Notes: The question about wage forecasts was not asked in 2008 or 2013. ST = shorter-term; MT = more medium-term; LT = longer-term.
Chart A1.3
To what extent are your reported probability distributions model or judgement-based?
(percentages of responses)
Sources: ECB SPF and staff calculations.
Notes: The question was not asked in 2008 and is not applicable to wages (no probability distributions are requested). ST = shorter-term; MT = more medium-term; LT = longer-term.
Annex 2 – Additional charts
Chart A2.1
Impact of a 10% increase in oil prices on forecasts
(percentage points)
Notes: Respondents were asked: “If your expected path for the oil price over your forecast horizon were suddenly to increase by 10% (and this shock were assumed to be permanent), what would be the approximate impact on your forecasts?” A total of 26 responses were received for HICP inflation, 23 for HICPX inflation, 20 for real GDP growth and 14 for the unemployment rate.
Chart A2.2
Impact of a 10% increase in EUR/USD exchange rate on forecasts
(percentage points)
Notes: Respondents were asked: “If your expected path for the oil price over your forecast horizon were suddenly to increase by 10% (and this shock were assumed to be permanent), what would be the approximate impact on your forecasts?” A total of 22 responses were received for HICP inflation, 15 for HICPX inflation, 19 for real GDP growth and 13 for the unemployment rate.
Annex 3 – Survey questionnaire
A copy of the questionnaire can be downloaded here.
Annex 4 – Chart data
Excel data for all charts, with counts of the responses received for the answers to each question, can be downloaded here.
AcknowledgementsThis paper should not be reported as representing the views of the European Central Bank (ECB). The views expressed are based on the synthesis by the authors of the SPF panel members inputs and do not necessarily reflect those of the ECB. The authors are grateful to the ECB SPF panel members for their inputs and to Joao Sousa, Sarah Holton and Thomas Westermann for useful suggestions. For further information or queries please contact Aidan Meyler (aidan.meyler@ecb.europa.eu).
Postal address 60640 Frankfurt am Main, Germany
Telephone +49 69 1344 0
Website www.ecb.europa.eu
All rights reserved. Reproduction for educational and non-commercial purposes is permitted provided that the source is acknowledged.
For specific terminology please refer to the ECB glossary (available in English only).
PDF ISBN 978-92-899-6718-1, ISSN 2363-3670, doi:10.2866/97916, QB-BR-24-005-EN-N
HTML ISBN 978-92-899-6717-4, ISSN 2363-3670, doi:10.2866/784891, QB-BR-24-005-EN-Q
-
The ECB has conducted a special survey every five years since 2008 (the ten-year anniversary of the SPF). Results from the previous special surveys can be found here: 2008, 2013 and 2018. A special survey was also conducted following the 2021 review of monetary policy strategy.
-
The questionnaire used in this special survey can be found in Annex 3. An Excel file containing the data used for the charts, including counts of responses received, can be found in Annex 4. Responses were received from 41 institutions, although not every respondent answered every question. The shares of respondents quoted in the discussion of the individual results are the shares of respondents who actually answered the specific question referred to.
-
In the questionnaire, “shorter-term” was defined as “one year ahead or less”, “medium-term” as “from one year to three years ahead” and “long-term” as “four to five years ahead”.
-
Level dependencies can stem from the role of excise taxes and margin behaviour in energy prices. The presence of excise duties/taxes means that, all other things being equal, there is a positive relationship between the level of the oil price and the elasticity of inflation with respect to an oil price shock. For a more detailed discussion, see Section 3.2 of ECB (2010) “Energy markets and the euro area macroeconomy”, ECB Occasional Paper No. 113, 16 June.
-
Theoretically, their choice of preferred measure could be a function of their “loss function”. For a more detailed discussion, see Wallis, K.F. (1999), “Asymmetric density forecasts of inflation and the Bank of England’s fan chart”, National Institute Economic Review, Vol. 167, No 1, National Institute of Economic and Social Research, January, pp. 106-112.
-
Respondents were asked: “Uncertainty (as measured by the standard deviation of the aggregate probability distribution) for each variable (inflation, growth and unemployment) in the SPF has increased to historically high levels. What do you think is behind this? A more accurate assessment of uncertainty, increase in actual uncertainty, other?”
-
Respondents were asked: “Given heightened forecast uncertainty, do you let your forecasts be more/less influenced by what your peers think?”

