The ECB Survey of Professional Forecasters - Second quarter of 2024
Summary
In the ECB’s Survey of Professional Forecasters (SPF) for the second quarter of 2024, expectations for headline HICP inflation, and those for HICP inflation excluding energy and food (HICPX), were essentially unchanged from the previous survey (conducted in the first quarter of 2024).[1] Respondents expected headline inflation to decline from 2.4% in 2024 to 2.0% in both 2025 and 2026. The main reasons cited for the expected profile of inflation were similar to those given in the previous survey round. Labour market tightness and wage growth were still viewed as high, but were also generally expected to moderate and thereby underpin the return of both headline and HICPX inflation to 2.0%. Longer-term HICP inflation expectations (for 2028) were unchanged at 2.0%. Respondents expected GDP growth of 0.5% in 2024, 1.4% in 2025 and 1.4% in 2026. The expectations for 2024 and 2025 were revised down and up by 0.1 percentage points respectively, while those for 2026 were unchanged. Respondents’ short-term GDP outlook is for a gradual strengthening of economic activity throughout 2024, supported primarily by growth in real wages. Longer-term growth expectations remained unchanged at 1.3%. The expected profile of the unemployment rate was revised downwards slightly over the entire horizon. Respondents continued to expect the unemployment rate to increase in 2024, to 6.6%, but to decline to 6.5% in 2026 and to 6.4% in the longer term.
Table 1
Results of the SPF in comparison with other expectations and projections
(annual percentage changes, unless otherwise indicated)
|
Survey horizon | ||||
|---|---|---|---|---|
|
Longer term1) | ||||
| HICP inflation | ||||
| Q2 2024 SPF | 2.4 | 2.0 | 2.0 | 2.0 |
| Previous SPF (Q1 2024) | 2.4 | 2.0 | 2.0 | 2.0 |
| ECB staff macroeconomic projections (March 2024) | 2.3 | 2.0 | 1.9 | - |
|
Consensus Economics2) (March 2024) |
2.3 | 2.0 | 2.0 | 2.0 |
| Memo: HICP inflation excluding energy, food, alcohol and tobacco | ||||
|
Q2 2024 SPF |
2.6 | 2.1 | 2.0 | 2.0 |
|
Previous SPF (Q1 2024) |
2.6 | 2.1 | 2.0 | 2.0 |
| 2.6 | 2.1 | 2.0 | - | |
|
Consensus Economics (March 2024) |
2.6 | 2.1 | - | - |
| Real GDP growth | ||||
| Q2 2024 SPF | 0.5 | 1.4 | 1.4 | 1.3 |
| Previous SPF (Q1 2024) | 0.6 | 1.3 | 1.4 | 1.3 |
| ECB staff macroeconomic projections (March 2024) | 0.6 | 1.5 | 1.6 | - |
| Consensus Economics (March 2024) | 0.5 | 1.3 | 1.5 | 1.3 |
|
Unemployment rate3) |
||||
| Q2 2024 SPF | 6.6 | 6.6 | 6.5 | 6.4 |
| Previous SPF (Q1 2024) | 6.7 | 6.6 | 6.5 | 6.5 |
| ECB staff macroeconomic projections (March 2024) | 6.7 | 6.6 | 6.6 | - |
| Consensus Economics (March 2024) | 6.6 | 6.6 | - | - |
1) Longer-term expectations refer to 2028.
2) Consensus Economics expectations for 2026 and the longer term are taken from the January 2024 survey.
3) As a percentage of the labour force.
1 HICP inflation expectations unchanged across all horizons
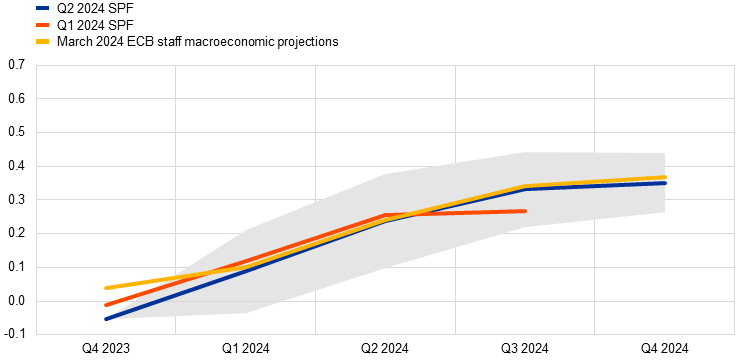
SPF respondents’ HICP inflation expectations for 2024 to 2026 were unchanged. Headline inflation was expected to decline from 2.4% in 2024 to 2.0% in both 2025 and 2026 (see Chart 1). Respondents’ qualitative explanations indicate that the main reasons behind the expected profile of inflation were similar to those given in the previous survey round. In particular, labour market tightness and wage growth were still viewed as high, but were also generally expected to moderate and thereby underpin the return of both headline inflation and HICP inflation excluding energy and food (HICPX) to 2.0%. Compared with the March 2024 ECB staff macroeconomic projections for the euro area, inflation expectations in this survey round were 0.1 percentage points higher for 2024 and 2026, but the same for 2025 (see Table 1).
Chart 1
Inflation expectations: overall HICP inflation and HICP inflation excluding energy and food
(annual percentage changes)
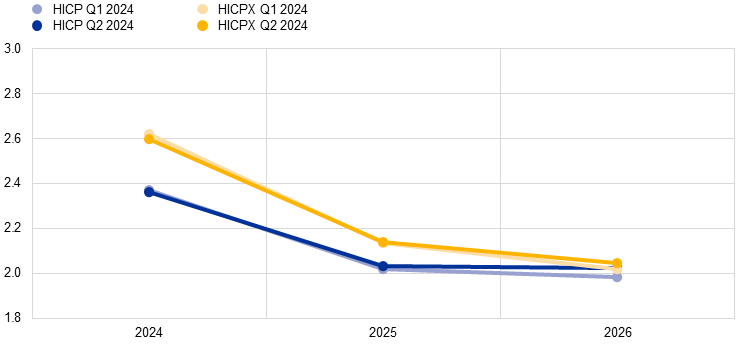
Expectations for HICPX inflation were also unchanged from the previous survey round. HICPX expectations for 2024, 2025 and 2026 stood at 2.6%, 2.1% and 2.0% respectively. Respondents indicated that this downward profile was due primarily to the expectation that services inflation would moderate gradually, largely on the back of slower wage growth, while goods inflation would remain at its already relatively low level (albeit with some possible fluctuation). The SPF forecasts for HICPX inflation were the same as those in the March 2024 ECB staff macroeconomic projections (see Table 1).
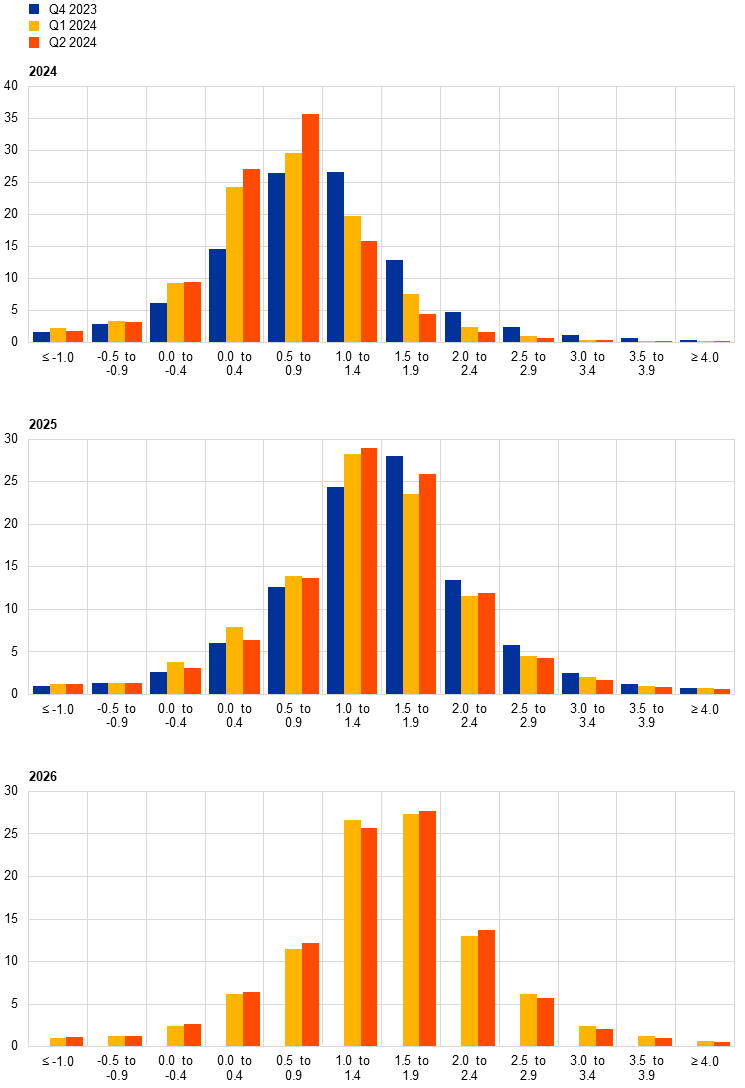
Uncertainty about the shorter and medium-term inflation outlook moderated slightly from still elevated levels, while the balance of risks remained tilted to the upside.[2] The high level of “aggregate uncertainty” is mainly attributable to the high “individual uncertainty”, as “disagreement” across forecasters has fallen substantially in recent survey rounds. Aggregate probability distributions for the calendar years from 2024 to 2026 are presented in Chart 2. The balance of risk indicator for the two-years-ahead horizon remained on the upside and increased somewhat. According to the qualitative remarks, the main uncertainties and upside risks related to labour market and wage developments, as well as the geopolitical situation. Some respondents saw weak economic growth as a downside risk.
Chart 2
Aggregate probability distributions for expected inflation in 2024, 2025 and 2026
(x-axis: HICP inflation expectations, annual percentage changes; y-axis: probability, percentages)
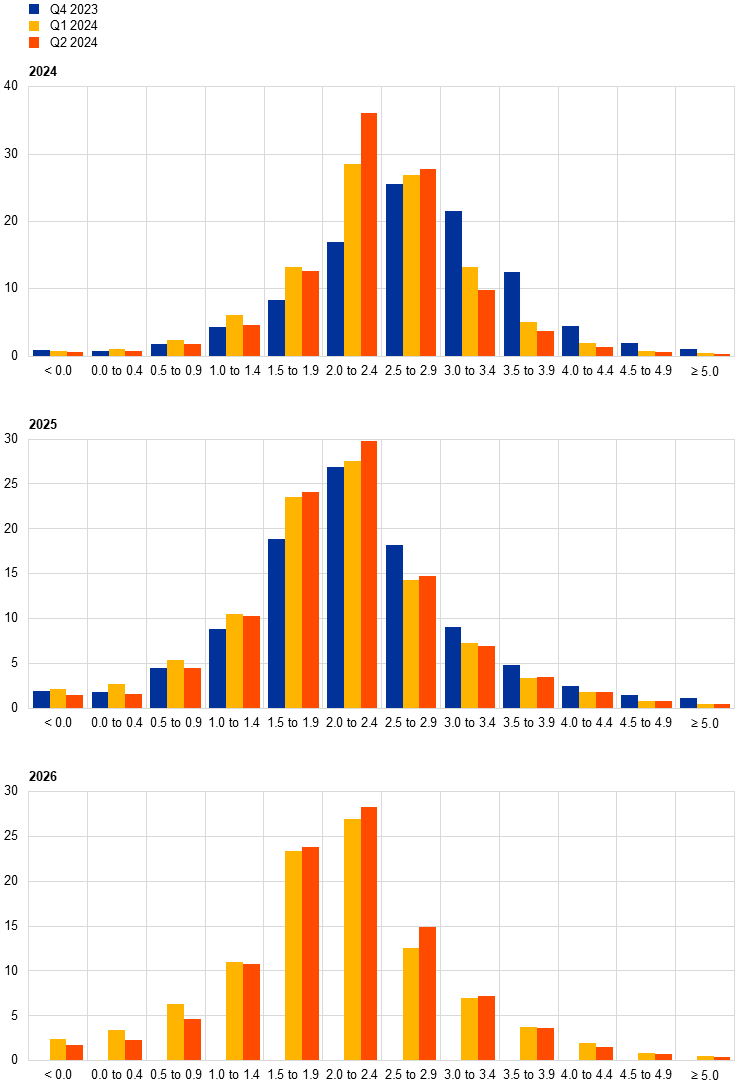
Notes: The SPF asks respondents to report their point forecasts and to separately assign probabilities to different ranges of outcomes. This chart shows the average probabilities assigned to different ranges of inflation outcomes in 2024, 2025 and 2026. Expectations for 2026 were not surveyed in the fourth quarter of 2023 round.
2 Longer-term inflation expectations unchanged at 2.0%
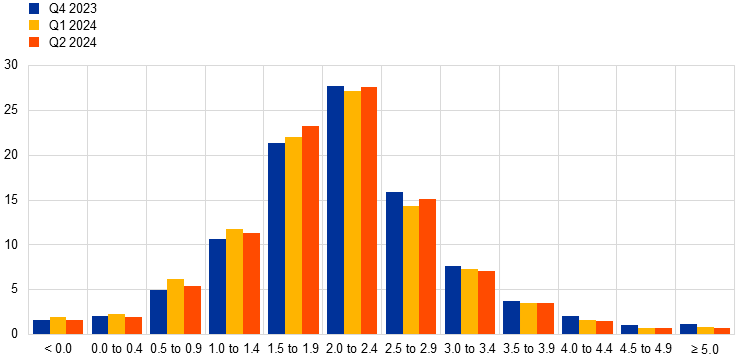
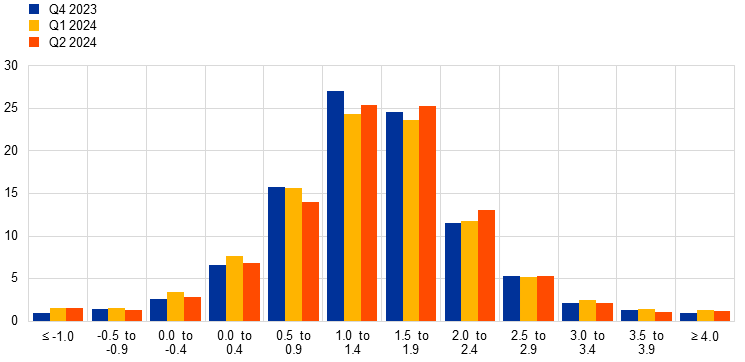
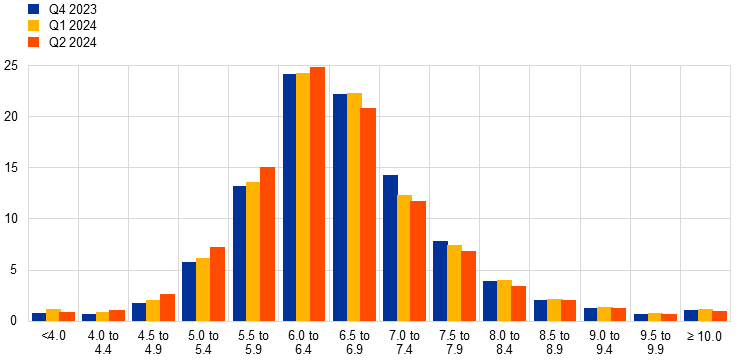
Longer-term inflation expectations (which refer to 2028) were unchanged at 2.0%. Thus, having stood at 2.1% since the second quarter of 2022 (after Russia’s invasion of Ukraine), average longer-term inflation expectations in the SPF have been at the target level of 2.0% in the past two survey rounds. This evolution also holds when excluding the two highest and lowest responses or when considering a balanced panel of those who also replied in the first quarter of 2024 survey round.[3] The median and modal point expectations were also unchanged at 2.0% (see Chart 3). In this survey round, the shape of the distribution of longer-term point expectations was broadly similar to that in the previous round. In particular, over half of the respondents reported longer-term inflation expectations of 2.0% (see Chart 4).
Chart 3
Longer-term inflation expectations
(annual percentage changes)
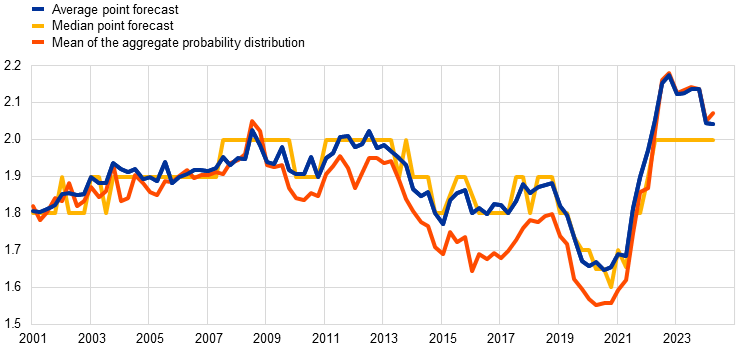
Chart 4
Distribution of point expectations for HICP inflation in the longer term
(x-axis: longer-term HICP inflation expectations, annual percentage changes; y-axis: percentages of respondents)
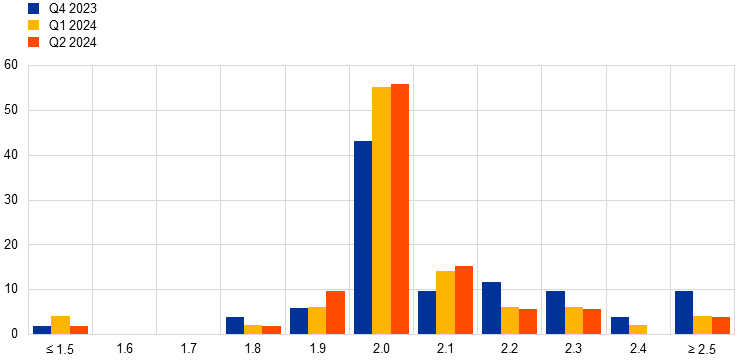
Notes: The SPF asks respondents to report their point forecasts and to separately assign probabilities to different ranges of outcomes. This chart shows the spread of point forecast responses. Longer-term expectations refer to 2028.
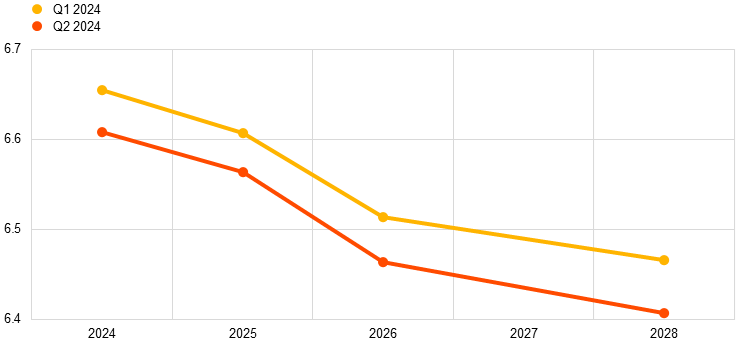
Uncertainty about longer-term inflation expectations eased further (but remained at elevated levels), while the balance of risks moved slightly to the upside. The high level of “aggregate uncertainty” (see Chart 5) is mainly attributable to heightened “individual uncertainty” rather than to “disagreement” (as disagreement is now slightly below the historical average prior to the recent surge in inflation). The balance of risk indicator increased slightly. Although it is now in positive territory and close to its highest previously observed level (in 2008), at 0.05 percentage points it is still well below the values seen on the negative side prior to the inflation surge. The probability of longer-term inflation being in the 1.5-2.5% range rose marginally to 51% (up from 49%), while the probabilities associated with outcomes above (i.e. >2.5%) and below (<1.5%) this range were 29% and 20% respectively.
Chart 5
Aggregate probability distribution for longer-term inflation expectations
(x-axis: HICP inflation expectations, annual percentage changes; y-axis: probability, percentages)
Notes: The SPF asks respondents to report their point forecasts and to separately assign probabilities to different ranges of outcomes. This chart shows the average probabilities assigned to different ranges of inflation outcomes in the longer term. Longer-term expectations refer to 2028.
The mean longer-term expectation for HICPX inflation was unchanged at 2.0%.[4] The median and modal longer-term point expectations for HICPX inflation were also unchanged at 2.0%. Broadly speaking, the evolution of longer-term expectations for HICP inflation and HICPX inflation has been similar since the fourth quarter of 2016 (when respondents were first asked about their expectations for HICPX inflation) with a difference in levels of around 0.1 percentage points on average, although this gap narrowed somewhat in this and the previous survey rounds.
3 Real GDP growth expectations largely unchanged
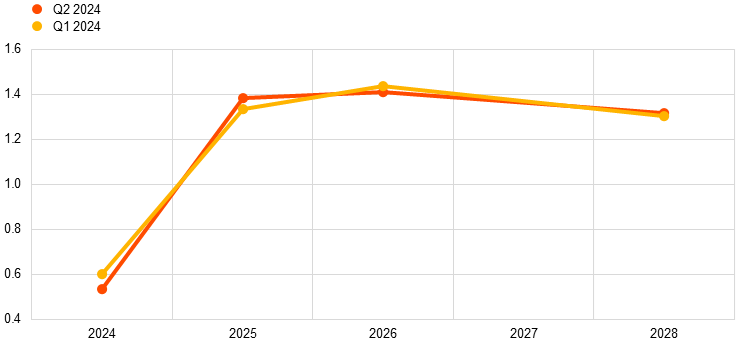
GDP growth expectations in the first quarter of 2024 survey round stood at 0.5% for 2024, 1.4% for 2025 and 1.4% for 2026 (see Chart 6). Compared with the previous survey round, these figures represent a small downward and upward revision of 0.1 percentage points for 2024 and 2025 respectively, and no change for 2026. Over the course of 2024 growth is expected to be driven by higher real wages, stronger private consumption and a gradual loosening of monetary policy. Longer-term growth expectations (which refer to 2028) stood at 1.3%, as in the previous survey round.
Respondents’ short-term GDP outlook is for a gradual strengthening of economic activity throughout 2024.[5] Expectations for quarter-on-quarter GDP growth in the first two quarters of 2024 were broadly in line with both the previous survey round and the March 2024 ECB staff macroeconomic projections (see Chart 7). Respondents mentioned rising real incomes as being a key factor behind their expectations of a pick-up in activity.
Chart 7
Expected profile of quarter-on-quarter GDP growth
(quarter-on-quarter percentage changes)
Note: The grey area indicates one standard deviation (of individual expectations) around average SPF expectations.
Expectations for real GDP growth rates imply no change in the level of economic activity from the previous survey round, but it is still significantly below the level implied by expectations before Russia’s invasion of Ukraine. Compared with the survey round conducted in early January 2022 prior to the invasion of Ukraine, the expected level of real GDP for 2026 is down by around 4% (see Chart 8).
Chart 8
Forecast profile of real GDP
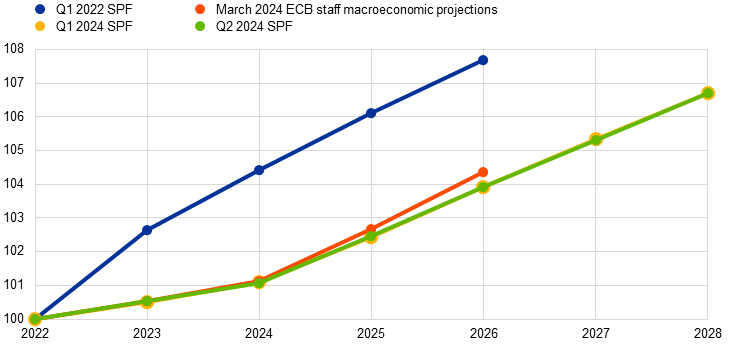
Note: Growth expectations for years not surveyed have been interpolated linearly.
Compared with the survey round for the first quarter of 2024, uncertainty about the two-years-ahead and the longer-term growth outlook was broadly unchanged, with the balance of risks remaining on the downside for the two-years-ahead horizon, but on the upside for the longer-term horizon (see Chart 9 and Chart 10). “Aggregate uncertainty” was unchanged for the two-years-ahead horizon and decreased for the longer-term horizon, in both cases remaining above the level prevailing before the COVID-19 pandemic, but still considerably below the peaks reached in 2020. For the two-years-ahead horizon, the balance of risk indicator fell marginally, after rising significantly in survey round for the first quarter of 2024, but nevertheless remained below but close to zero. For the longer-term horizon, it edged up slightly compared with the previous round, continuing to hover in positive territory.
Chart 9
Aggregate probability distributions for GDP growth expectations for 2024, 2025 and 2026
(x-axis: real GDP growth expectations, annual percentage changes; y-axis: probability, percentages)
Notes: The SPF asks respondents to report their point forecasts and to separately assign probabilities to different ranges of outcomes. This chart shows the average probabilities assigned to different ranges of real GDP growth outcomes in 2024, 2025 and 2026. Expectations for 2026 were not surveyed in the fourth quarter of 2023 round.
Chart 10
Aggregate probability distributions for longer-term GDP growth expectations
(x-axis: real GDP growth expectations, annual percentage changes; y-axis: probability, percentages)
Notes: The SPF asks respondents to report their point forecasts and to separately assign probabilities to different ranges of outcomes. This chart shows the average probabilities assigned to different ranges of real GDP growth outcomes in the longer term. Longer-term expectations refer to 2028.
4 Unemployment rate expectations revised downwards slightly
In the second quarter of 2024 survey round, respondents expected unemployment rates of 6.6%, 6.6% and 6.5% for 2024, 2025 and 2026 respectively. When unrounded, the expected profile of the unemployment rate was revised down by around 0.05 percentage points for all horizons. When rounded (to one decimal place), the revisions are only visible for 2024 (6.6%) and for longer-term unemployment (2028), which fell to 6.4%. As in the previous round, the unemployment rate was expected to increase in 2024 before declining to 6.5% by 2026 and then further to 6.4% in the longer term (see Chart 11). Respondents have been favourably surprised by unemployment rate outcomes, which they believe reflect ongoing resilience in the labour market.
Chart 11
Expectations for the unemployment rate
(percentages of the labour force)
Compared with the previous survey round, the level of uncertainty about unemployment rate expectations fell slightly for the one-year and two-years-ahead horizons, but was unchanged for the longer-term horizon. Respondents noted that the uncertainty about the unemployment outlook was consistent with that of the broader macroeconomic outlook (see Chart 12 and Chart 13).
Chart 12
Aggregate probability distributions for the unemployment rate in 2024, 2025 and 2026
(x-axis: unemployment rate expectations, percentages of the labour force; y-axis: probability, percentages)
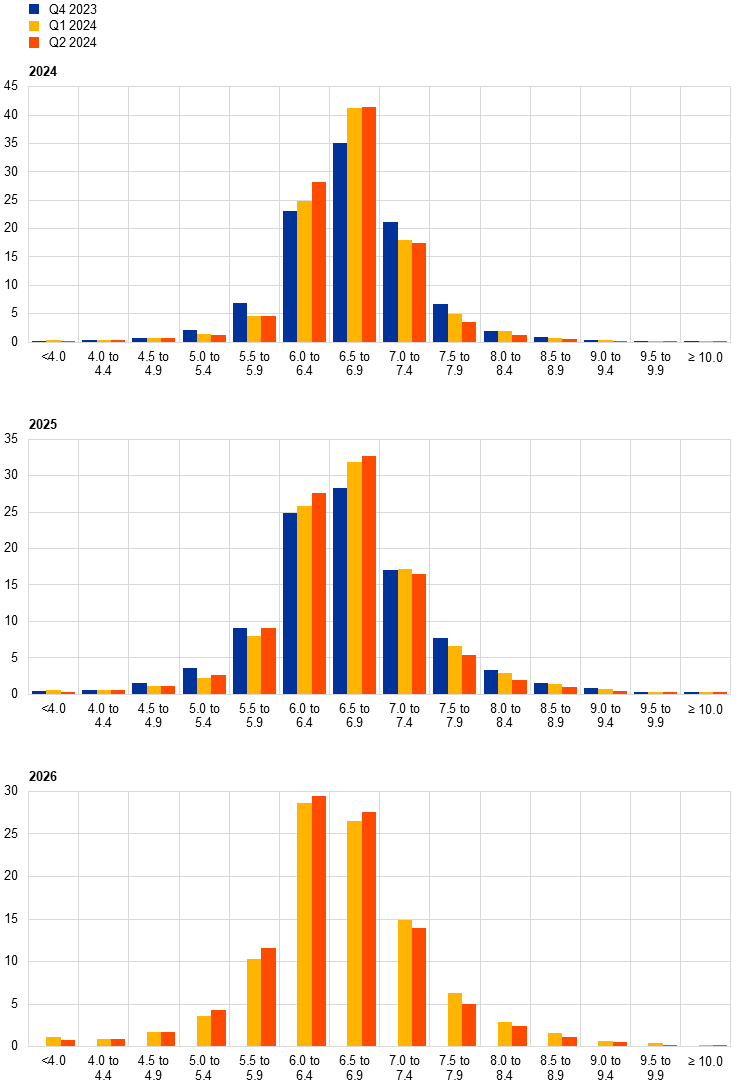
Notes: The SPF asks respondents to report their point forecasts and to separately assign probabilities to different ranges of outcomes. This chart shows the average probabilities assigned to different ranges of unemployment rate outcomes for 2024, 2025 and 2026. Expectations for 2026 were not surveyed in the fourth quarter of 2023 round.
Chart 13
Aggregate probability distribution for the unemployment rate in the longer term
(x-axis: unemployment rate expectations, percentages of the labour force; y-axis: probability, percentages)
Notes: The SPF asks respondents to report their point forecasts and to separately assign probabilities to different ranges of outcomes. This chart shows the average probabilities assigned to different ranges of unemployment rate outcomes in the longer term. Longer-term expectations refer to 2028.
5 Expectations for other variables
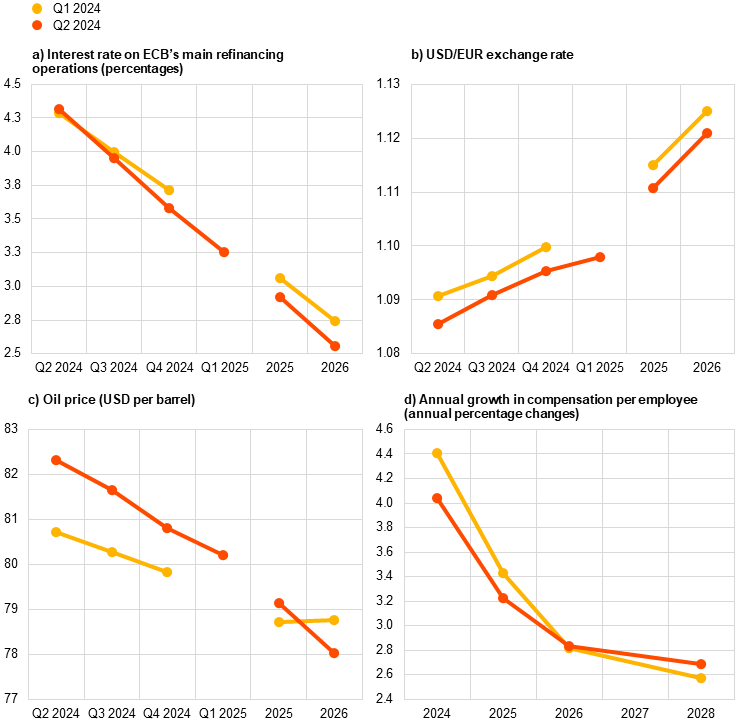
Forecasters expected the interest rate on the ECB’s main refinancing operations (MROs) to fall to 4.25% in the second quarter of 2024, reaching 3.5% by the fourth quarter of the year and declining further to 3% in 2025 and 2.5% in 2026. They expected the euro to appreciate marginally against the US dollar, from USD 1.09 in the second quarter of 2024 to USD 1.12 in 2026, and oil prices to remain at USD 82 per barrel in the second and third quarters of 2024, before falling to USD 78 per barrel by 2026. They also expected nominal wages to increase by 4.0% in 2024 and 3.2% in 2025, before moderating to a growth rate of 2.8% in 2026 and 2.7% in the longer term.
Respondents expected the ECB’s MRO rate to fall to 4.25% in the second quarter of 2024, before falling further to 3.5% by the end of the year. The mean forecast implies expectations of a first rate cut in the second quarter of 2024. However, the majority of respondents expected the rate to remain at 4.5% in that quarter and rate cuts thereafter to reduce it to 3.5% by the end of the year, and further to 3.0% in 2025 and 2.5% in 2026 (see Chart 14, panel a). Regarding the changes to the operational framework for implementing monetary policy announced by the ECB on 13 March 2024, some respondents explicitly mentioned that those changes were reflected in their forecasts. It appears that around one-third of respondents had incorporated the narrowing of the spread between the MRO rate and the deposit facility rate into their forecasts, which largely explains the downward revision of 15 basis points to the expected profile of the MRO rate compared with the previous survey round.
On average, the USD/EUR exchange rate was expected to rise from USD 1.09 in the second quarter of 2024 to USD 1.12 in 2026 (see Chart 14, panel b). The expected profile follows a similar trajectory to that in the previous survey round.
Compared with the previous round, the expected level of US dollar-denominated oil prices was revised upwards slightly for 2024. Expectations for 2025 were broadly unchanged at USD 79 per barrel, while there was a slight downward revision from USD 79 to USD 78 per barrel for 2026 (see Chart 14, panel c).
Expectations for annual growth in compensation per employee were revised down by 0.4 percentage points for 2024 and by 0.2 percentage points for 2025, to 4.0% and 3.2% respectively. Respondents expected wage growth to moderate further to 2.8% in 2026 (unchanged from the previous survey round) and revised up slightly their expectations of longer-term wage growth (2028) by 0.1 percentage points, to 2.7% (see Chart 14, panel d).
Chart 14
Expectations for other variables
Annex (chart data)
Excel data for all charts can be downloaded here.
Postal address 60640 Frankfurt am Main, Germany
Telephone +49 69 1344 0
Website www.ecb.europa.eu
All rights reserved. Reproduction for educational and non-commercial purposes is permitted provided that the source is acknowledged.
For specific terminology please refer to the glossary (available in English only).
PDF ISBN 978-92-899-6452-4, ISSN 2363-3670, doi:10.2866/909763, QB-BR-24-002-EN-N
HTML ISBN 978-92-899-6451-7, ISSN 2363-3670, doi:10.2866/858304, QB-BR-24-002-EN-Q
-
The survey was conducted between 18 and 21 March 2024 and 61 responses were received. This response rate is slightly above the historical average for survey rounds conducted in the second quarter of the year. All participants were provided with the same set of the latest available data for annual HICP inflation (February 2024: overall inflation, 2.6%; underlying inflation, 3.1%), annual GDP growth (fourth quarter of 2023: 0.1%) and unemployment (January 2024: 6.4%). This report was drafted on the basis of data available on 27 March 2024.
-
The width of the reported probability distributions indicates the perceived degree of overall uncertainty, whereas the asymmetry of the distributions indicates whether that uncertainty is more concentrated on higher or lower outturns – i.e. it measures the perceived balance of risks. As regards uncertainty, it can be shown that the width (or standard deviation) of the aggregate probability distribution (i.e. “aggregate uncertainty”) is a function of the average width (or standard deviation) of the individual probability distributions (i.e. “individual uncertainty”) and the standard deviation of the individual point forecasts (i.e. “disagreement”).
-
Of the 45 respondents who provided longer-term HICP inflation expectations in both the second and the first quarter of 2024, 34 made no changes to their forecasts, two revised them upwards and nine revised them downwards.
-
Of the 34 respondents who provided longer-term HICPX inflation expectations in both the second and the first quarter of 2024, 26 made no changes to their forecasts, two revised them upwards and six revised them downwards.
-
Based on data from 51 respondents.
-
12 April 2024

