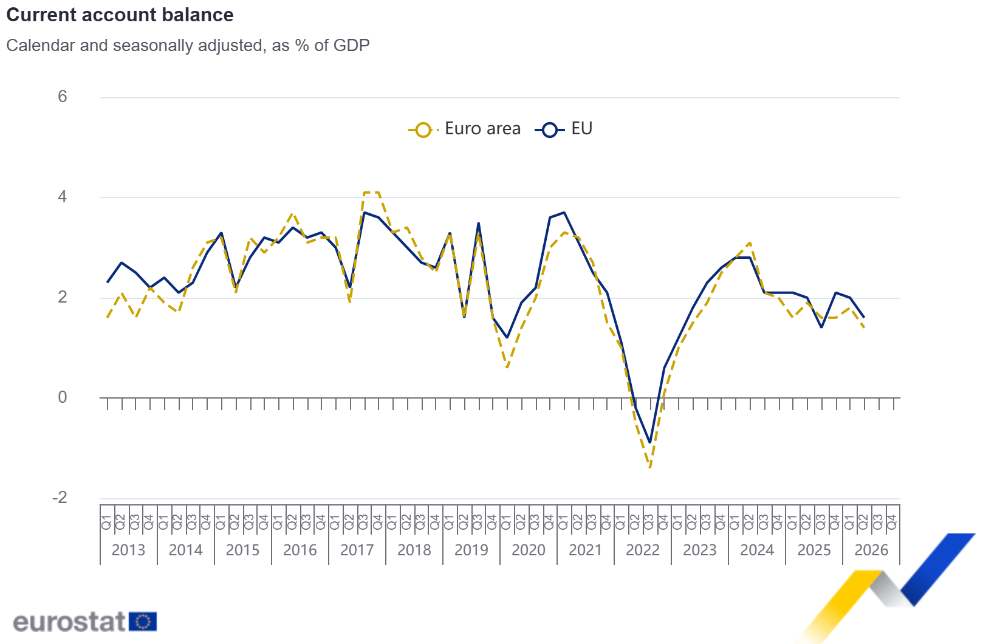
EU current account surplus €80.2 bn in 2Q26
EU current and capital accounts
In the second quarter of 2026 compared with the first quarter of 2026, based on seasonally adjusted data
-
the surplus of the goods account decreased (+€62.9 bn compared to +€63.6 bn),
-
the surplus of the services account decreased (+€41.7 bn compared to +€48.1 bn),
-
the surplus of the primary income account decreased (+€0.8 bn compared to +€15.7 bn) and
-
the deficit of the secondary income account decreased (-€25.2 bn compared to -€29.3 bn).
In addition, during the same period, the deficit of the capital account increased (-€16.2 bn compared to -€1.7 bn).
|
EU current and capital accounts
|
||||||||
|---|---|---|---|---|---|---|---|---|
|
Current account |
Goods |
Services |
Primary income |
Secondary income |
Current account as
|
Capital account |
||
|
Q2 2025 |
Credit |
1432.8 | 650.5 | 400.2 | 337.2 | 44.9 | 30.6% | 8.8 |
|
Debit |
1341.1 | 570.0 | 361.7 | 339.6 | 69.8 | 28.6% | 29.4 | |
|
Balance |
91.7 | 80.5 | 38.5 | -2.4 | -24.9 | 2.0% | -20.7 | |
|
Q3 2025 |
Credit |
1400.4 | 649.6 | 387.4 | 321.6 | 41.7 | 29.6% | 16.6 |
|
Debit |
1332.3 | 565.4 | 367.1 | 328.2 | 71.6 | 28.2% | 17.9 | |
|
Balance |
68.1 | 84.2 | 20.4 | -6.6 | -29.9 | 1.4% | -1.3 | |
|
Q4 2025 |
Credit |
1439.2 | 655.1 | 408.9 | 332.9 | 42.3 | 30.0% | 17.0 |
|
Debit |
1340.4 | 568.5 | 365.2 | 335.3 | 71.4 | 28.0% | 12.1 | |
|
Balance |
98.7 | 86.6 | 43.7 | -2.5 | -29.1 | 2.1% | 4.8 | |
|
Q1 2026 |
Credit |
1449.2 | 651.8 | 416.7 | 339.1 | 41.6 | 30.1% | 23.8 |
|
Debit |
1351.1 | 588.3 | 368.6 | 323.4 | 71.0 | 28.0% | 25.5 | |
|
Balance |
98.0 | 63.6 | 48.1 | 15.7 | -29.3 | 2.0% | -1.7 | |
|
Q2 2026 |
Credit |
1523.5 | 711.8 | 430.4 | 336.7 | 44.7 | 31.2% | 9.7 |
|
Debit |
1443.3 | 648.9 | 388.6 | 335.9 | 70.0 | 29.6% | 25.9 | |
|
Balance |
80.2 | 62.9 | 41.7 | 0.8 | -25.2 | 1.6% | -16.2 | |
|
Source: Eurostat ( dataset: bop_eu6_q )
|
||||||||

|
Euro area current account
|
|||||
|---|---|---|---|---|---|
|
2025 |
2026 |
||||
|
Q2 |
Q3 |
Q4 |
Q1 |
Q2 |
|
|
Current account balance |
75.0 | 64.0 | 65.7 | 74.1 | 57.0 |
|
Balance of trade in goods |
79.6 | 78.2 | 74.4 | 59.8 | 75.3 |
|
Balance of trade in services |
34.7 | 29.3 | 46.8 | 38.7 | 33.6 |
|
Balance of primary income |
6.1 | 3.6 | -2.0 | 27.0 | -1.5 |
|
Balance of secondary income |
-45.3 | -47.0 | -53.5 | -51.3 | -50.4 |
|
Current account balance as % of GDP |
1.9% | 1.6% | 1.6% | 1.8% | 1.4% |
|
Source: ECB
|
|||||
EU main partners
In the second quarter of 2026, based on non-seasonally adjusted data, the EU recorded current account surpluses with the United Kingdom (+€89.8 bn), Switzerland (+€23.9 bn), Canada (+€12.9 bn), Brazil (+€10.3 bn), Hong Kong (+€9.6 bn), offshore financial centres (+€9.2 bn), Russia (+€1.9 bn), Japan (+€0.8 bn) and India (+€0.4 bn). Deficits were registered with China (-€66.6 bn) and the USA (-€30.3 bn).
EU financial account
Based on non-seasonally adjusted data, in the second quarter of 2026
-
direct investment assets of the EU increased by €120.5 bn and
-
direct investment liabilities increased by €1.4 bn.
As a result, the EU was a net direct investor to the rest of the world with net outflows of €119.1 bn.
At the same time,
-
portfolio investment recorded a net inflow of €200.7 bn, and
-
other investment recorded a net outflow of €104.8 bn.
|
EU financial account
|
|||||
|---|---|---|---|---|---|
|
2025 |
2026 |
||||
|
Q2 |
Q3 |
Q4 |
Q1 |
Q2 |
|
|
Net financial account |
73.5 | 115.3 | 72.2 | -26.1 | 96.5 |
|
Net acquisition of assets |
358.3 | 390.1 | 267.8 | 530.2 | 676.8 |
|
Net incurrence of liabilities |
284.8 | 274.8 | 195.6 | 556.3 | 580.3 |
|
Net direct investment |
30.6 | 30.1 | 162.0 | 1.2 | 119.1 |
|
Net acquisition of assets |
6.2 | 46.9 | 149.5 | 36.3 | 120.5 |
|
Net incurrence of liabilities |
-24.4 | 16.8 | -12.5 | 35.1 | 1.4 |
|
Net portfolio investment |
15.0 | 124.4 | -114.1 | -83.2 | -200.7 |
|
Net acquisition of assets |
201.6 | 307.1 | 63.2 | 184.1 | 209.9 |
|
Net incurrence of liabilities |
186.6 | 182.8 | 177.3 | 267.3 | 410.6 |
|
Net other investment |
28.1 | -47.4 | 26.3 | 56.7 | 104.8 |
|
Net acquisition of assets |
150.7 | 27.8 | 57.1 | 310.6 | 273.1 |
|
Net incurrence of liabilities |
122.6 | 75.3 | 30.8 | 253.9 | 168.3 |
|
Net financial derivatives and employee stock options |
-12.8 | -12.7 | -17.4 | -32.1 | 60.1 |
|
Reserve assets |
12.7 | 21.0 | 15.5 | 31.3 | 13.3 |
|
Source: Eurostat (dataset: bop_eu6_q )
|
|||||
Current account of Member States (including intra-EU flows)
As concerns the total (intra-EU plus extra-EU) current account balances of the EU Member States, based on available non-seasonally adjusted data, eleven Member States recorded surpluses and sixteen recorded deficits in the second quarter of 2026. The highest surpluses were observed in Germany (+€45.0 bn), Ireland (+€19.7 bn), the Netherlands (+€16.9 bn), Denmark (+€13.2 bn), Sweden (+€11.6 bn) and Spain (+€8.7 bn). The largest deficits were recorded for Romania (-€7.8 bn), France (-€6.5 bn), Poland (-€6.2 bn) and Greece (-€3.8 bn).
Tables
|
EU current account, breakdown by main partner countries
|
||||
|---|---|---|---|---|
|
Period |
Credit |
Debit |
Balance |
|
| Q2 2025 | 1465.6 | 1391.5 | 74.2 | |
| Q2 2026 | 1557.4 | 1498.8 | 58.6 | |
|
United Kingdom |
Q2 2025 | 247.0 | 172.4 | 74.6 |
| Q2 2026 | 268.1 | 178.2 | 89.8 | |
| Q2 2025 | 334.8 | 359.8 | -25.0 | |
| Q2 2026 | 351.9 | 382.2 | -30.3 | |
|
Switzerland |
Q2 2025 | 149.1 | 105.6 | 43.5 |
| Q2 2026 | 140.6 | 116.7 | 23.9 | |
|
China* |
Q2 2025 | 82.0 | 131.7 | -49.7 |
| Q2 2026 | 79.8 | 146.4 | -66.6 | |
|
Russia |
Q2 2025 | 12.0 | 11.8 | 0.2 |
| Q2 2026 | 12.4 | 10.5 | 1.9 | |
|
Japan |
Q2 2025 | 36.8 | 35.9 | 0.8 |
| Q2 2026 | 39.1 | 38.3 | 0.8 | |
|
Canada |
Q2 2025 | 29.2 | 18.3 | 10.9 |
| Q2 2026 | 32.7 | 19.8 | 12.9 | |
|
Hong Kong |
Q2 2025 | 19.5 | 12.6 | 7.0 |
| Q2 2026 | 24.8 | 15.2 | 9.6 | |
|
India |
Q2 2025 | 23.1 | 25.5 | -2.4 |
| Q2 2026 | 25.6 | 25.2 | 0.4 | |
|
Brazil |
Q2 2025 | 24.7 | 16.3 | 8.3 |
| Q2 2026 | 29.4 | 19.2 | 10.3 | |
|
Offshore financial centres |
Q2 2025 | 85.7 | 82.6 | 3.1 |
| Q2 2026 | 103.3 | 94.1 | 9.2 | |
|
Other countries |
Q2 2025 | 441.2 | 431.4 | 9.8 |
| Q2 2026 | 474.5 | 468.2 | 6.3 | |
|
* Excluding Hong Kong Source: Eurostat (dataset: bop_eu6_q )
|
||||
|
EU goods account, breakdown by main partner countries
|
||||
|---|---|---|---|---|
|
Partner |
Period |
Credit |
Debit |
Balance |
| Q2 2025 | 652.8 | 572.8 | 80.1 | |
| Q2 2026 | 714.6 | 652.6 | 62.0 | |
|
United Kingdom |
Q2 2025 | 91.4 | 44.8 | 46.6 |
| Q2 2026 | 103.4 | 49.6 | 53.9 | |
| Q2 2025 | 133.1 | 75.8 | 57.3 | |
| Q2 2026 | 150.8 | 92.3 | 58.5 | |
|
Switzerland |
Q2 2025 | 43.7 | 36.6 | 7.1 |
| Q2 2026 | 53.4 | 39.1 | 14.3 | |
|
China* |
Q2 2025 | 53.8 | 115.1 | -61.2 |
| Q2 2026 | 52.3 | 130.6 | -78.3 | |
|
Russia |
Q2 2025 | 7.5 | 6.9 | 0.6 |
| Q2 2026 | 7.8 | 6.4 | 1.4 | |
|
Japan |
Q2 2025 | 16.5 | 15.0 | 1.5 |
| Q2 2026 | 16.7 | 14.8 | 1.9 | |
|
Canada |
Q2 2025 | 12.3 | 7.1 | 5.2 |
| Q2 2026 | 15.0 | 7.5 | 7.5 | |
|
Hong Kong |
Q2 2025 | 7.6 | 4.1 | 3.5 |
| Q2 2026 | 8.8 | 5.0 | 3.8 | |
|
India |
Q2 2025 | 11.7 | 14.5 | -2.8 |
| Q2 2026 | 13.6 | 13.9 | -0.4 | |
|
Brazil |
Q2 2025 | 8.9 | 10.3 | -1.3 |
| Q2 2026 | 12.1 | 13.5 | -1.4 | |
|
Offshore financial centres |
Q2 2025 | 17.7 | 13.9 | 3.8 |
| Q2 2026 | 18.9 | 18.6 | 0.3 | |
|
Other countries |
Q2 2025 | 256.1 | 232.7 | 23.4 |
| Q2 2026 | 270.6 | 266.3 | 4.3 | |
|
* Excluding Hong Kong Source: Eurostat (dataset: bop_eu6_q )
|
||||
|
EU services account, breakdown by main partner countries
|
||||
|---|---|---|---|---|
|
Partner |
Period |
Credit |
Debit |
Balance |
|
Total |
Q2 2025 | 403.5 | 351.1 | 52.4 |
| Q2 2026 | 434.1 | 378.4 | 55.7 | |
|
United Kingdom |
Q2 2025 | 79.1 | 62.7 | 16.4 |
| Q2 2026 | 86.7 | 65.2 | 21.5 | |
|
USA |
Q2 2025 | 89.7 | 126.7 | -37.0 |
| Q2 2026 | 94.1 | 143.3 | -49.2 | |
|
Switzerland |
Q2 2025 | 46.4 | 26.9 | 19.5 |
| Q2 2026 | 46.2 | 27.8 | 18.4 | |
|
China* |
Q2 2025 | 16.8 | 12.1 | 4.7 |
| Q2 2026 | 17.4 | 11.5 | 5.9 | |
|
Russia |
Q2 2025 | 1.3 | 0.9 | 0.4 |
| Q2 2026 | 1.3 | 0.9 | 0.4 | |
|
Japan |
Q2 2025 | 10.4 | 6.5 | 4.0 |
| Q2 2026 | 12.6 | 7.1 | 5.4 | |
|
Canada |
Q2 2025 | 7.9 | 4.6 | 3.2 |
| Q2 2026 | 8.4 | 5.0 | 3.4 | |
|
Hong Kong |
Q2 2025 | 8.3 | 3.8 | 4.5 |
| Q2 2026 | 11.0 | 4.0 | 7.0 | |
|
India |
Q2 2025 | 7.4 | 9.6 | -2.3 |
| Q2 2026 | 7.9 | 9.8 | -1.9 | |
|
Brazil |
Q2 2025 | 5.7 | 2.3 | 3.5 |
| Q2 2026 | 6.7 | 2.7 | 4.0 | |
|
Offshore financial centres |
Q2 2025 | 26.3 | 25.1 | 1.2 |
| Q2 2026 | 34.9 | 27.6 | 7.3 | |
|
Other countries |
Q2 2025 | 112.4 | 73.7 | 38.8 |
| Q2 2026 | 117.9 | 77.5 | 40.4 | |
|
* Excluding Hong Kong Source: Eurostat (dataset: bop_eu6_q )
|
||||
|
EU direct investment, breakdown by main partner countries
|
||||
|---|---|---|---|---|
|
Partner |
Period |
Net acquisition of
|
Net incurrence of
|
Net |
|
Total |
Q2 2025 | 6.2 | -24.4 | 30.6 |
| Q2 2026 | 120.5 | 1.4 | 119.1 | |
|
United Kingdom |
Q2 2025 | -13.0 | 6.5 | -19.5 |
| Q2 2026 | -1.5 | -52.9 | 51.3 | |
|
USA |
Q2 2025 | -6.2 | -26.0 | 19.9 |
| Q2 2026 | 42.7 | 7.6 | 35.0 | |
|
Switzerland |
Q2 2025 | 0.6 | -16.9 | 17.4 |
| Q2 2026 | 10.6 | 16.8 | -6.2 | |
|
China* |
Q2 2025 | 5.1 | 2.4 | 2.7 |
| Q2 2026 | 5.6 | 6.9 | -1.3 | |
|
Russia |
Q2 2025 | 1.3 | 1.8 | -0.5 |
| Q2 2026 | 2.5 | -0.5 | 2.9 | |
|
Japan |
Q2 2025 | 0.0 | 4.7 | -4.7 |
| Q2 2026 | -0.9 | 3.1 | -3.9 | |
|
Canada |
Q2 2025 | -3.7 | -0.3 | -3.4 |
| Q2 2026 | 4.8 | 3.7 | 1.0 | |
|
Hong Kong |
Q2 2025 | 0.8 | 1.8 | -1.0 |
| Q2 2026 | 1.5 | 6.7 | -5.2 | |
|
India |
Q2 2025 | 3.5 | -0.9 | 4.4 |
| Q2 2026 | 2.5 | 0.0 | 2.5 | |
|
Brazil |
Q2 2025 | 9.3 | 2.0 | 7.3 |
| Q2 2026 | 7.6 | -2.0 | 9.6 | |
|
Offshore financial centres |
Q2 2025 | 6.3 | 0.0 | 6.4 |
| Q2 2026 | 14.7 | 17.4 | -2.7 | |
|
Other countries |
Q2 2025 | 3.0 | 2.3 | 0.7 |
| Q2 2026 | 32.0 | 1.2 | 30.7 | |
|
* Excluding Hong Kong Source: Eurostat (dataset: bop_eu6_q )
|
||||
|
Current accounts balances – national data (intra-EU + extra-EU)
|
|||||
|---|---|---|---|---|---|
|
2025 |
2026 |
||||
|
Countries |
Q2 |
Q3 |
Q4 |
Q1 |
Q2 |
|
Belgium |
-3.5 | 1.1 | 1.6 | 1.6 | 1.7 |
|
Bulgaria |
-0.7 | -1.1 | -3.8 | -2.7 | -2.5 |
|
Czechia |
-2.2 | -0.4 | 0.6 | 2.8 | -2.8 |
|
Denmark |
14.1 | 14.6 | 14.3 | 7.9 | 13.2 |
|
Germany |
41.2 | 43.5 | 50.7 | 63.3 | 45.0 |
|
Estonia |
0.1 | -0.2 | 0.4 | -0.1 | -0.3 |
|
Ireland |
14.0 | 15.5 | 14.9 | 17.9 | 19.7 |
|
Greece |
-3.5 | 1.5 | -6.9 | -7.1 | -3.8 |
|
Spain |
16.0 | 16.6 | 11.7 | 9.9 | 8.7 |
|
France |
-12.1 | -3.8 | 22.3 | -16.1 | -6.5 |
|
Croatia |
-1.9 | 3.6 | -2.3 | -3.6 | -1.9 |
|
Italy |
7.2 | 10.7 | 1.3 | -0.2 | -0.6 |
|
Cyprus |
-0.7 | -0.2 | -1.2 | -1.1 | -1.3 |
|
Latvia |
-0.7 | -0.6 | -0.5 | -0.3 | -0.9 |
|
Lithuania |
-0.4 | 0.1 | -0.1 | 0.3 | -1.1 |
|
Luxembourg |
-1.5 | 1.1 | -0.5 | 1.0 | -0.4 |
|
Hungary |
1.5 | 1.4 | 0.8 | 0.2 | -0.3 |
| 0.4 | 0.5 | 0.3 | 0.4 | 0.2 | |
|
Netherlands |
13.1 | 19.3 | 33.7 | 26.4 | 16.9 |
|
Austria |
0.9 | 1.7 | 2.4 | 6.6 | 0.3 |
|
Poland |
-2.0 | -5.3 | -1.1 | 0.7 | -6.2 |
|
Portugal |
0.3 | 3.2 | -0.1 | -1.1 | -0.8 |
|
Romania |
-7.5 | -8.1 | -6.3 | -5.4 | -7.8 |
|
Slovenia |
0.7 | 1.0 | 0.5 | 0.4 | 0.8 |
|
Slovakia |
-1.5 | -1.5 | -1.6 | -0.6 | -0.8 |
|
Finland |
1.0 | 2.1 | 1.5 | -2.7 | 1.3 |
|
Sweden |
9.5 | 8.9 | 9.2 | 9.1 | 11.6 |
|
Iceland |
-0.8 | 0.2 | -0.2 | -0.2 | -0.8 |
|
Norway |
15.8 | 15.1 | 12.7 | 21.9 | 25.6 |
|
Switzerland |
10.9 | 14.7 | 0.7 | 18.0 | 25.7 |
|
Bosnia and Herzegovina |
-0.3 | -0.1 | -0.3 | -0.5 | -0.4 |
|
Montenegro |
-0.5 | 0.0 | -0.7 | -0.6 | -0.5 |
|
Moldova |
-0.9 | -0.7 | -0.9 | -0.8 | : |
|
North Macedonia |
-0.2 | 0.0 | -0.3 | -0.3 | -0.3 |
|
Albania |
-0.3 | 0.7 | -0.3 | -0.3 | -0.1 |
|
Serbia |
-1.3 | -0.8 | -1.4 | -0.1 | -1.3 |
|
Türkiye |
-10.4 | 5.9 | -9.7 | -20.4 | : |
|
Kosovo* |
-0.4 | 0.2 | -0.4 | -0.3 | -0.5 |
|
* Kosovo, under United Nations Security Council Resolution 1244/99. : data not available Source: Eurostat (dataset: bop_c6_q )
|
|||||
|
Services accounts balances – national data (intra-EU + extra-EU)
|
|||||
|---|---|---|---|---|---|
|
2025 |
2026 |
||||
|
Countries |
Q2 |
Q3 |
Q4 |
Q1 |
Q2 |
|
Belgium |
-4.1 | -2.7 | 0.1 | -1.5 | -2.6 |
|
Bulgaria |
2.4 | 2.7 | 1.7 | 1.6 | 1.8 |
|
Czechia |
1.0 | 1.3 | 0.4 | 1.2 | 1.0 |
|
Denmark |
0.8 | 1.2 | 0.2 | -1.1 | 0.6 |
|
Germany |
-20.4 | -26.7 | -14.9 | -11.6 | -19.4 |
|
Estonia |
0.9 | 0.8 | 0.9 | 0.8 | 1.0 |
|
Ireland |
12.6 | 7.6 | 7.6 | 9.4 | 3.8 |
|
Greece |
6.4 | 12.0 | 3.3 | 1.3 | 6.2 |
|
Spain |
30.6 | 35.4 | 26.4 | 25.2 | 33.0 |
|
France |
18.2 | 12.4 | 10.5 | 6.3 | 23.2 |
|
Croatia |
3.4 | 8.9 | 1.7 | 0.8 | 3.4 |
|
Italy |
1.8 | 2.3 | -6.1 | -4.3 | 3.0 |
|
Cyprus |
2.5 | 3.0 | 2.9 | 1.6 | 2.1 |
|
Latvia |
0.5 | 0.5 | 0.5 | 0.5 | 0.6 |
|
Lithuania |
2.5 | 2.7 | 2.7 | 2.5 | 2.7 |
|
Luxembourg |
5.2 | 7.3 | 7.7 | 6.5 | 7.7 |
|
Hungary |
2.9 | 3.8 | 2.8 | 2.1 | 3.1 |
| 2.1 | 2.3 | 1.8 | 1.8 | 2.1 | |
|
Netherlands |
13.2 | 8.6 | 13.3 | 9.2 | 13.9 |
|
Austria |
-0.4 | 0.1 | 1.7 | 5.8 | -0.4 |
|
Poland |
10.7 | 9.7 | 9.0 | 9.2 | 10.1 |
|
Portugal |
8.2 | 11.4 | 7.1 | 6.5 | 8.3 |
|
Romania |
3.0 | 2.9 | 3.4 | 3.7 | 3.6 |
|
Slovenia |
1.1 | 1.3 | 1.1 | 0.7 | 1.1 |
|
Slovakia |
0.1 | 0.1 | 0.1 | 0.2 | 0.1 |
|
Finland |
-1.0 | -1.4 | -0.6 | -1.4 | -2.2 |
|
Sweden |
-3.3 | -3.3 | -2.5 | -2.7 | -1.3 |
|
Iceland |
0.4 | 1.0 | 0.4 | 0.2 | 0.5 |
|
Norway |
-2.4 | -2.2 | -2.4 | -2.7 | -1.9 |
|
Switzerland |
-2.4 | -2.6 | -7.7 | -4.0 | -4.8 |
|
Bosnia and Herzegovina |
0.5 | 0.7 | 0.6 | 0.4 | 0.5 |
|
Montenegro |
0.4 | 1.0 | 0.2 | 0.1 | 0.4 |
|
Moldova |
0.2 | 0.2 | 0.3 | 0.3 | : |
|
North Macedonia |
0.2 | 0.3 | 0.2 | 0.2 | 0.2 |
|
Albania |
0.9 | 1.9 | 1.0 | 0.8 | 1.0 |
|
Serbia |
0.5 | 0.3 | 0.9 | 0.6 | 0.7 |
|
Türkiye |
13.7 | 21.5 | 12.7 | 6.3 | : |
|
Kosovo* |
0.4 | 1.1 | 0.5 | 0.5 | 0.4 |
|
* Kosovo, under United Nations Security Council Resolution 1244/99. : data not available Source: Eurostat (dataset: bop_c6_q )
|
|||||
Notes for users
Revisions and timetable
The EU balance of payments estimates for the reference quarter are based on figures provided by the Member States to Eurostat 82 days (euro area Member States) or 85 days (non-euro area Member States) after the end of the reference quarter and should be considered as provisional. Figures may be subject to revision when data for later quarters are transmitted by the Member States.
A more limited set of monthly data is available in the Eurostat on-line database approximately 51 days after the end of the reference month. The publication timetable of balance of payments statistics for 2026 is available here.
Methods and definitions
The current account covers all transactions occurring between resident and non-resident entities, and refers to international trade in goods and services, as well as primary and secondary income. The capital account comprises capital transfers and the acquisition and disposal of non-produced, non-financial assets. The financial account records transactions that involve financial assets and liabilities, and take place between residents and non-residents and is further subdivided into direct investment, portfolio investment, other investment, financial derivatives and employee stock options and reserve assets. Further details of the statistical concepts and definitions used can be found on the Eurostat website here.
In line with the agreed allocation of responsibility, the European Central Bank (ECB) is in charge of compiling and disseminating monthly and quarterly balance of payments and quarterly international investment position statistics for the euro area, while the European Commission (Eurostat) is responsible for monthly, quarterly and annual aggregates of the EU. The aggregates for the euro area and the EU are compiled consistently on the basis of Member States' transactions with residents of countries outside the euro area and the European Union respectively.
Geographical information
Up to 31 December 2025, the euro area included Belgium, Germany, Estonia, Ireland, Greece, Spain, France, Croatia, Italy, Cyprus, Latvia, Lithuania, Luxembourg, Malta, the Netherlands, Austria, Portugal, Slovenia, Slovakia and Finland (EA20). From 1 January 2026, the euro area also includes Bulgaria (EA21).
The aggregate data series for the euro area in this Euro indicator release refer to the official composition of the euro area as from 1 January 2026.
The European Union (EU27) includes Belgium, Bulgaria, Czechia, Denmark, Germany, Estonia, Ireland, Greece, Spain, France, Croatia, Italy, Cyprus, Latvia, Lithuania, Luxembourg, Hungary, Malta, the Netherlands, Austria, Poland, Portugal, Romania, Slovenia, Slovakia, Finland and Sweden.
Offshore Financial Centres (OFC) is an aggregate that includes 40 countries. As example, the aggregate contains financial centres such as Liechtenstein, Guernsey, Jersey, the Isle of Man, Andorra, Gibraltar, Panama, Bermuda, the Bahamas, the Cayman Islands, British Virgin Islands, Bahrain, Hong Kong, Singapore and the Philippines.
For more information
Get in touch
Further information on data
Peter POSPISIL
Phone: (+352) 4301 34 324
Matthias LUDWIG
Phone: (+352) 4301 38 380
E-mail: ESTAT-BOP@ec.europa.eu


