Volkswagen Group stays on track in challenging environment and expects improved margin in the second half of the year
Volkswagen Group stays on track in challenging environment and expects improved margin in the second half of the year

Wolfsburg. The Volkswagen Group has published its half-year figures for 2026.
“The realignment of Volkswagen Group over the past three years is delivering results. Throughout the group. For the full year, we expect a robust performance above the prior year in a challenging environment – even though our operating result in the first half was around 12 percent below the prior year. Globally, we delivered more cars than in the previous year – excluding the Chinese market, which slumped by 20 percent. Our order book also reflects a positive trend: more than 70,000 orders for our new Electric Urban Car Family around the ID. Polo in just a few weeks – and orders for all-electric vehicles in Europe increased by more than 50 percent in the second quarter. Our products are achieving top scores in comparative tests, awards, and quality studies. Applying disciplined cost managed, we have managed to offset continued unavoidable headwinds in the double-digit billions. At the same time, the environment for the automotive industry remains extremely challenging: geopolitical crises, trade conflicts, high regulatory requirements, volatile markets and intensified competition. In an unprecedented risk scenario, Volkswagen Group enters the next phase of its transformation – from a position of strength and with a clear understanding of the opportunities ahead. With the most comprehensive and far-reaching program in the company’s history – for products, technologies, competitiveness, structures and growth areas. With our future plan, we will become even more innovative, faster, more attractive and robust - and sustainably ensure the Volkswagen Group’s success.”
“We are launching attractive new vehicles, consistently implementing our software roadmap, reducing investments and overhead costs. At the same time, we generated a Net Cash Flow of 3.2 billion euro in the first half of the year. Despite such progress, our operating margin of 3.8 percent remains too low and underlines the call to action. In an environment where the Chinese total market is down by 20 percent and Chinese competitors are increasing exports and thereby competitive pressure in Europe, the currently planned initiatives are not sufficient. We must accelerate efforts to structurally lower our cost base and sustainably improve our earnings quality. This includes improved vehicle cost structures, lower overhead costs, higher efficiency in our plants, faster technology development, and quicker decision-making processes. Therefore we need to significantly reduce complexity - in our product portfolio and platforms, in our equity portfolio, as well as in our leadership and decision-making structures. What matters now is swift and consistent implementation.”
Key Figures
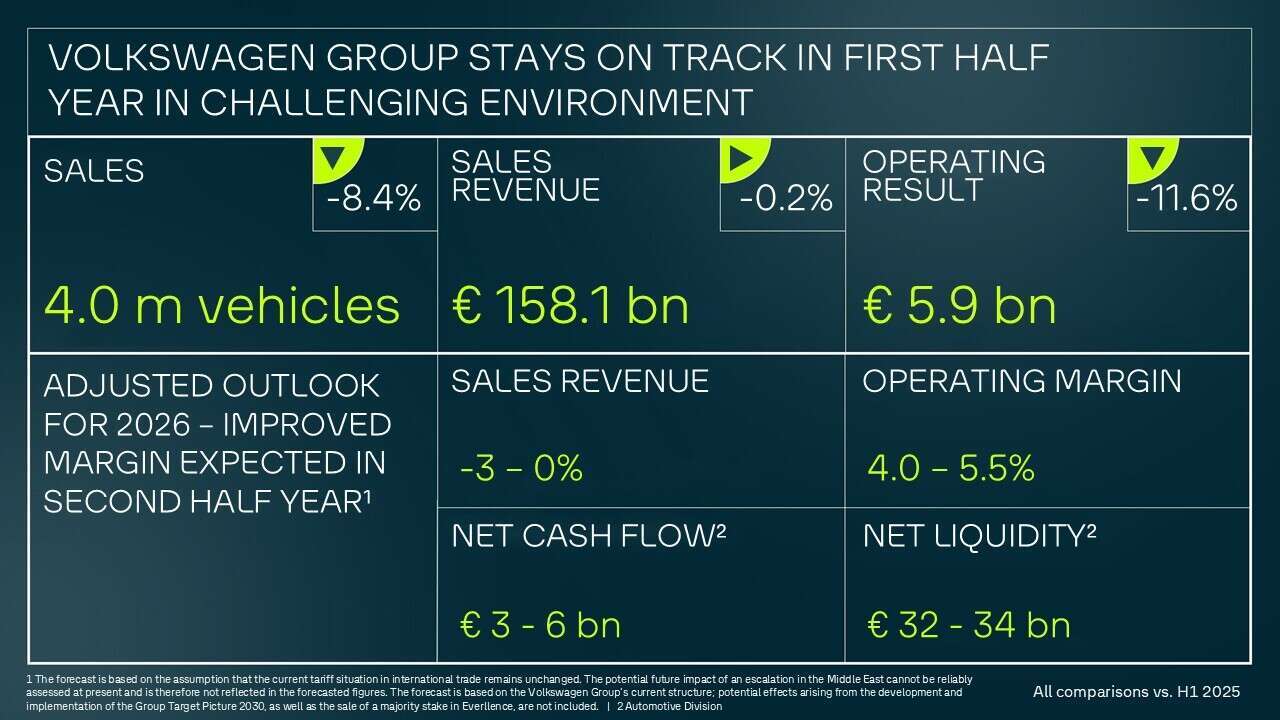
Sales revenue in the first half of 2026 remained largely at prior-year level despite a challenging market environment (-0.2%). Increase in sales revenue in Financial Services (+7.9%) almost offsets the decline in the automotive division (-2.1%). In the second quarter, sales revenue amounted to 82.4 billion EUR (+2.0%).
Adjusted Outlook for 2026
The Volkswagen Group expects sales revenue in 2026 to develop within a range of –3 to 0 percent compared with the previous year (previously: range of 0 to +3 percent). The Group’s operating return on sales is still expected to be between 4.0 and 5.5 percent.
In the Automotive Division, the company continues to expect an investment ratio of between 11 and 12 percent in 2026. Net cash flow for the year 2026 is expected to range between EUR 3 billion and EUR 6 billion. Net liquidity in the Automotive Division is expected to range between EUR 32 billion and EUR 34 billion in 2026. The Volkswagen Group continues to pursue its objective of maintaining a solid financing and liquidity policy.
Challenges are expected in particular from the macroeconomic environment, uncertainties regarding restrictions in international trade and geopolitical tensions, increasing competitive intensity, volatile commodity, energy and foreign exchange markets, as well as changing requirements resulting from emissions-related regulations.
The forecast is based on the assumption that the current tariff situation in international trade remains unchanged. The potential future impact of an escalation in the Middle East cannot be reliably assessed at present and is therefore not reflected in the forecasted figures. The forecast is based on the Volkswagen Group’s current structure; potential effects arising from the development and implementation of the Group Target Picture 2030, as well as the sale of a majority stake in Everllence, are not included.
Further information on the brand groups
Core
Operating result for H1 2026 improved significantly to 3.6 billion EUR – an increase of 4.5% compared with prior-year period. Positive effects from optimised product costs, strict cost management and synergies within the brand group are reflected in a slight improvement in operating return on sales and an increase in revenue – despite a challenging market environment and increasing competitive pressure.
H1 2026 Results Core
Progressive
Operating result of 1.1 billion EUR, slightly exceeding the previous year figure. In a continued challenging market environment, factors such as strict cost discipline had a positive impact. The operating return on sales stood at 3.8% (previous year: 3.3%.
H1 2026 Results Progressive
Sport Luxury
Porsche Automotive achieved an operating result of 1.2 billion EUR (previous year: 0.8 billion EUR). Return on sales was 8.0%. Revenue amounted to 15.2 billion EUR (previous year: 16.1 billion EUR). Automotive net cash flow was 1.0 billion EUR, with a net cash flow margin of 6.7%. Earnings performance resulted from last year’s comprehensive realignment, a strong price- and mix quality, and lower charges related to provisions from 2025.
H1 2026 Results Luxury
Trucks / TRATON
TRATON GROUP’s order intake rose by 30% to 181,900 vehicles in the first half of 2026; with 21.1 billion EUR, the Group’s revenue was almost on par with the previous year, whilst operating result stood at 942 million EUR (-24%), and the operating return on sales was 4.5% (-1.4ppt).
H1 2026 Results TRATON Group
CARIAD
In H1 2026, CARIAD increased its revenue by EUR 250 million to 815 million EUR, driven by software deliveries to the brand groups. The operating result improved significantly to -855 million EUR (previous year: -1,172 million EUR). This improvement highlights the impact of the transformation program and the consistent cost discipline across all areas.
Group Mobility
Operating result came in at 1.7 billion EUR (-7.6%) due to higher risk provisions.
Positive developments were seen in new contracts (+1.2%) and in the existing contract portfolio (+3.1%).
H1 2026 Results VW Group Mobility
Key Figures Volkswagen Group
|
Q2 |
H1 |
||||||
|
2026 |
2025 | % |
2026 |
2025 | % | ||
|
Volume Data1 in thousands |
|||||||
| Deliveries to customers (units) | 2,077 | 2,272 | -8.6 | 4,126 | 4,405 | –6,3 | |
| Vehicle sales (units) | 2,043 | 2,263 | -9.7 | 3,997 | 4,363 | -8,4 | |
| Production (units) | 2,014 | 2,325 | -13.4 | 4,171 | 4,519 | -7,7 | |
| Employees (on Jun. 30, 2026/Dec. 31, 2025) | 652.2 | 662.9 | -1,6 | ||||
| Sales revenue | 82,444 | 80,806 | 2.0 | 158,102 | 158,364 | –0.2 | |
| Operating result | 3,469 | 3,834 | –9.5 | 5,931 | 6,707 | –11.6 | |
| Operating return on sales (%) | 4.2 | 4.7 | 3.8 | 4.2 | |||
| Earnings before tax | 2,538 | 3,314 | –23.4 | 4,773 | 6,423 | –25.7 | |
| Return on sales before tax (%) | 3.1 | 4.1 | 3.0 | 4.1 | |||
| Earnings after tax | 1,538 | 2,291 | –32.9 | 3,103 | 4,477 | –30.7 | |
|
Automotive Division |
|||||||
| Cash flows from operating activities | 6,301 | 5,714 | 10.3 | 12,963 | 10,410 | 24.5 | |
|
Cash flows from investing activities attributable to operating activities2 |
5,128 | 6,237 | –17.8 | 9,797 | 11,760 | –16.7 | |
| Net cash flow | 1,172 | –523 | - | 3,166 | –1,350 | - | |
| Net liquidity at June 30 | 32,750 | 28,387 | 15.4 | ||||
| Investment ratio | 10.0 | 11.6 | 10.6 | 11.4 | |||
1) Including the equity-accounted joint ventures in China. The prior-year deliveries have been updated based on statistical extrapolation.
2) Excluding acquisitions and disposals of equity investments: Q2 EUR 4,564 (5,563) million; H1 2026 EUR 9,386 (10,397) million.
Key figures by brand group and divisions from January 1 to June 30, 2026
| Vehicle sales | Sales revenue | Operating result | Operating margin | |||||
|
Thousand vehicles/
|
|
|
2026 |
2025 |
2026 |
2025 |
2026 |
2025 |
| Core brand group | 2,590 | 2,527 | 73,035 | 72,480 | 3,611 | 3,455 | 4.9 | 4.8 |
| Progressive brand group | 528 | 574 | 29,177 | 32,573 | 1,122 | 1,087 | 3.8 | 3.3 |
|
Sport Luxury brand group1 |
121 | 135 | 15,158 | 16,138 | 1,208 | 832 | 8.0 | 5.2 |
| CARIAD | 815 | 564 | -855 | -1,172 | – | – | ||
| Battery | 88 | 11 | -473 | -592 | – | – | ||
| Brand group Trucks | 152 | 153 | 21,090 | 21,195 | 942 | 1,245 | 4.5 | 5.9 |
|
Equity-accounted companies in China2 |
856 | 1,242 | – | – | ||||
| Volkswagen Group Mobility | 31,574 | 29,362 | 1,673 | 1,811 | 5.3 | 6.2 | ||
|
Other3 |
-249 | -267 | -12,836 | -13,959 | -1,048 | 230 | -8.2 | 1.6 |
| Volkswagen Group | 3,997 | 4,363 | 158,102 | 158,364 | 5,931 | 6,707 | 3.8 | 4.2 |
1) Including Porsche Financial Services: sales revenue EUR 17,229 (18,157) million, operating result EUR 1,348 (1,007) million.
2) The sales revenue and operating result of the equity-accounted companies in China are not included in the consolidated figures; the share of the operating result generated by these companies amounted to EUR 184 (506) million.
3) In the operating result, mainly intragroup items recognized in profit or loss, in particular from the elimination of intercompany profits; the figure includes depreciation and amortization of identifiable assets as part of purchase price allocation, as well as companies not allocated to the brands.
Half-Yearly Financial Report 2025
On July 24, 2026 the Volkswagen Group published the results for the first half of 2026.


