Enhancing climate analysis: new insights through data
15 January 2026
By Pietro Bellamio, Catarina De Melo Branco, Julika Herzberg, Małgorzata Osiewicz, Sofia Papadopoulos, Eva Pereira, Dimitra Theleriti and Caroline Willeke
The ESCB has strengthened its climate indicators, introducing new breakdowns of sustainable bonds, data on how inflation affects banks’ carbon intensity metrics, and improved data and models assessing physical risks. This ECB Blog post offers a quick overview of the enhancements.
Statistical climate indicators are continuously evolving. The European System of Central Banks (ESCB) statisticians have recently introduced further improvements that include more detailed information on sustainable debt securities, with new breakdowns by maturity, interest rate type and currency. In addition to this, we analyse the main drivers of carbon footprint of financial institutions, such as portfolio changes, decarbonisation, company revenue and inflation. With the help of improved damage estimation and newly available data, in this blog post we show evidence of rising physical climate risks. We also explore selected enhancements and demonstrate how advanced statistical techniques and new data sources can provide further insights into climate analysis.
These are just a few examples. A full list of enhancements of our climate indicators is available in the technical annex. The data, together with the methodology and more detailed results, are available on our climate-related indicators webpage.
How does the currency of issuance vary across different sustainable debt securities types in the euro area?
Chart 1
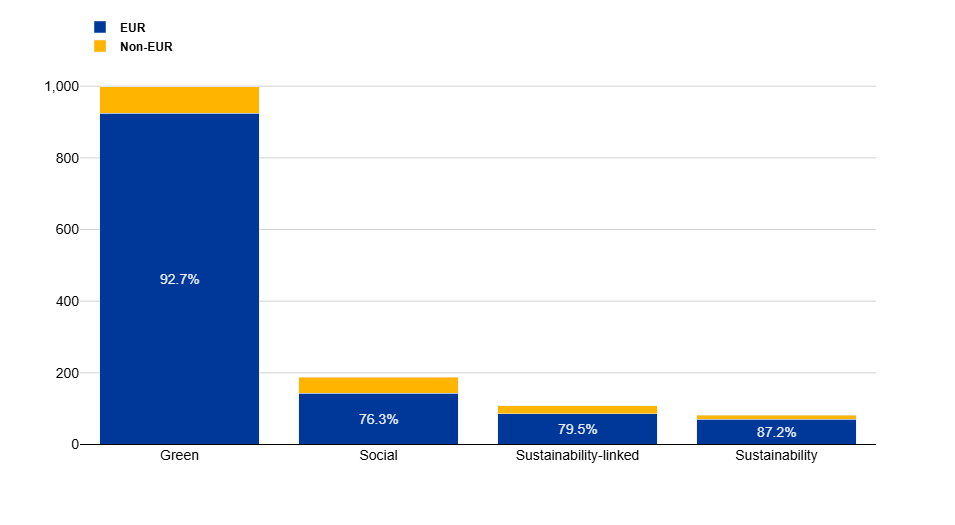
Euro area issuances of sustainable debt securities by currency of denomination
Source: Centralised Securities Database (CSDB).
Notes: green: debt securities where the proceeds are used to finance projects with clear environmental benefits. Social: debt securities where the proceeds are used to finance projects that address social issues and seek to achieve positive social outcomes. Sustainability-linked: debt securities for which the financial and/or structural characteristics can vary depending on whether the issuer achieves predefined sustainability/ESG objectives. Sustainability: debt securities where the proceeds are used to finance a combination of both green and social projects. The reference period is June 2025.
Let’s start with the new data on sustainable debt securities, including green bonds. This data provides information on the proceeds raised to finance sustainable projects, a relevant factor in funding the green transition, while these bonds do not directly lead to a reduction in carbon emissions. They also show the demand for such products as investment opportunities. Most sustainable bonds issued in the euro area are denominated in euro. However, there are notable variations in the share of non-euro-denominated issuances across the different types of sustainable debt securities.
Green and sustainability bonds closely mirror the overall trend observed for all euro area debt securities, of which 7.3% and 12.8% respectively are issued in non-euro currencies (compared with 10% for all euro area debt securities). By contrast, sustainability-linked and social bonds display a far higher proportion of issuances in non-euro currencies, accounting for 20.5% and 23.7% respectively.
We can also see these developments in the holdings of sustainable debt securities issued by euro area residents: non-euro area investors hold 34% of the social bonds, 25% of the sustainability-linked and sustainability bonds, and only 18% of the green bonds issued by euro area residents (June 2025).
These figures suggest that euro area issuers of sustainability-linked and social bonds seem to target investors in international capital markets to a greater degree, with the issuers of social bonds being particularly successful in doing so. Meanwhile, the green bond market within the euro area is particularly robust, supported by well-established frameworks, such as the EU taxonomy and the European Green Bond Standard. These initiatives have fostered strong local demand for euro-denominated green bonds.
Can inflation lead to underestimating carbon intensity?
Banks are making progress in greening their loan and securities portfolios. To monitor this progress, it is crucial to understand what drives change in the carbon intensity of bank’s portfolios. Carbon intensity refers to the amount of emissions produced relative to an entity’s economic size. The carbon intensity of the bank’s credit portfolio represents the emissions generated by the economic activities of the bank’s customers that are financed through its loans. This metric focuses specifically on the portion of the customers’ activities attributable to the bank’s financing, rather than the customers’ overall emissions.
In our analysis, company revenues serve as the key proxy for economic size, as it is the most widely used measure. However, not every decline in carbon intensity necessarily indicates a greening of the portfolio. Company revenues are measured in nominal terms and an increase in revenues (while emissions remain constant) may overstate the actual decline in carbon intensity when considered in real terms. When we track trends over time, it is essential to adjust growth in nominal revenues for inflation. Chart 2 shows that part of the year-on-year decline in portfolio carbon intensity is due to inflation; however, this is a small part compared with that attributable to real revenues. Still, in 2022 and 2023 inflation contributed to the decrease in carbon intensity as much as, or even more than, emissions reduction, with the largest impact in 2022, coinciding with the Harmonised Index of Consumer Prices (HICP) inflation trend in the euro area over this period. This shows that ignoring the role of inflation in the economy would lead to underestimating actual carbon intensity. Looking ahead, we will continue refining the methodology on inflation adjustment, along with other enhancements in the area of indirect emissions and forward-looking indicators.
Chart 2
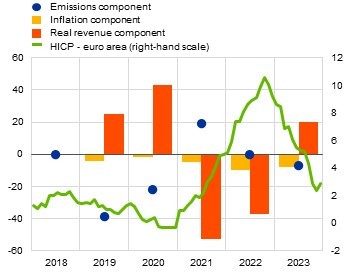
Breakdown of annual changes in weighted average carbon intensity components of euro area banks’ securities portfolios, corporate group level, and HICP
|
a) Breakdown of annual changes in weighted average carbon intensity and HICP |
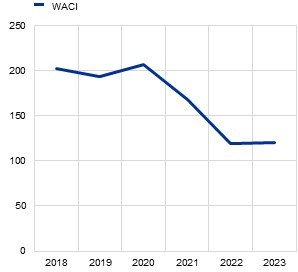
b) Weighted average carbon intensity (WACI) |
|---|---|
| (left-hand scale: change in tonnes of Scope 1 CO2 emissions eq. per million EUR of revenue compared with the previous year and tonnes of Scope 1 CO2 emissions eq. per million EUR of revenue; right-hand scale: year-on-year percentage change) | (tonnes of Scope 1 CO2 emissions eq. per million EUR of revenue) |
 |
 |
Sources: ESCB calculations are based on data from the analytical credit dataset (AnaCredit), Register of Institutions and Affiliates Data (RIAD), Securities Holdings Statistics by Sector (SHSS), Institutional Shareholder Services (ISS) and HICP.
Notes: Securities include listed shares and debt securities. WACI is adjusted for inflation and exchange rate effects. Company revenues are adjusted for inflation using Gross Value Added (GVA) deflators from International Data Cooperation (IDCM) and National Accounts by Industry (INA) series. GVA reflects the contribution of a company, or sector to the economy, capturing the value of goods and services produced minus the cost of inputs. Using GVA deflators ensures that the adjustment for inflation is specific to the sector in which the company operates. For illustration, the chart presents the broader inflation measure - the Harmonised Index of Consumer Prices (HICP) - reflecting general inflation trends, while remaining consistent with the trajectory of the selected deflators. Portfolio weight component and exchange rate component not shown. For more information, please refer to the statistical paper and the technical annex.
Do newer hazard models alter physical risk assessment?
The recent publication of the statistical climate indicators introduces enhancements to physical risk assessment, improving hazard estimates and better capturing the assets at risk from natural disasters. We illustrate their impacts with the example of windstorm indicators.
The data benefit from two key improvements. First, we included newly available hazard data. For windstorms, the estimations were prepared by ESCB statisticians using the latest available satellite-based data, ensuring transparency and control over the methodology. Second, we enhanced the identification of physical assets at risk from natural disasters by more accurately determining their locations and values. This was possible through the collaboration with central banks to improve information on company addresses and standardisation of address fields, such as street names, house numbers, and postal codes, as well as balance sheet details, incorporating richer data on fixed assets and including inventories.
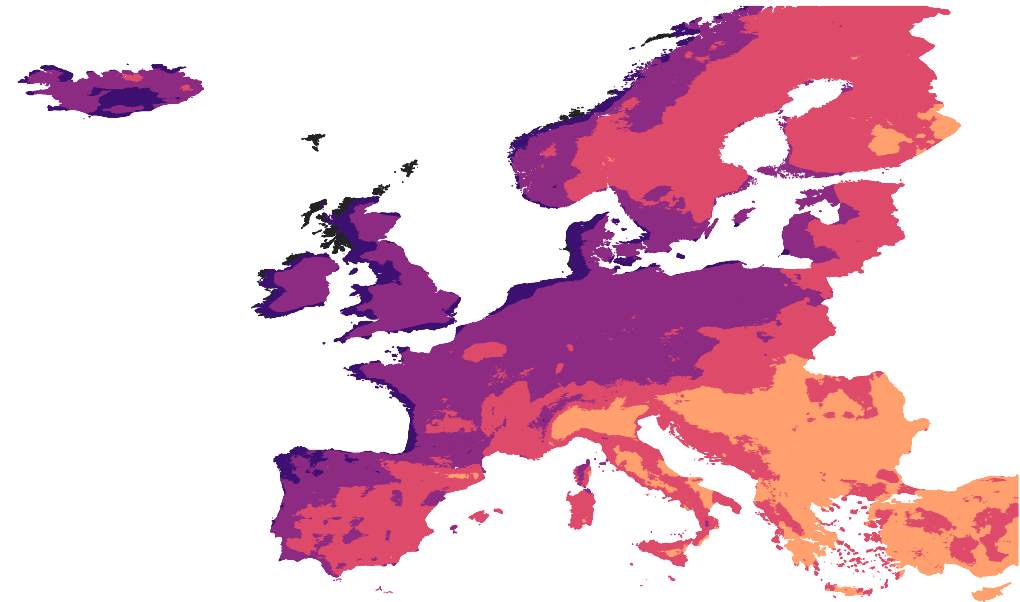
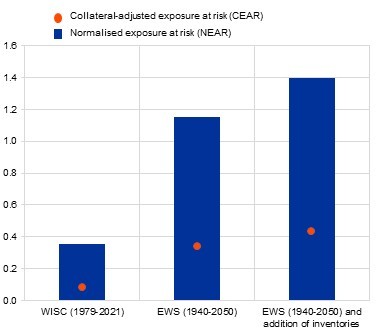
The results indicate that northern and coastal regions of Europe face the highest risk from windstorms (Chart 3, panel a). Chart 3 demonstrates the impact of the enhancements (panel b), which presents the expected loss indicators, the normalised exposure at risk (NEAR) and collateral-adjusted exposure at risk (CEAR) indicators, calculated using different sets of data. Incorporating newer datasets and updated climate models increases expected losses more than threefold. A further increase is observed when we add inventories to the assessment: expected losses rise by 22% for NEAR, which represents the baseline indicators, and by 26% for CEAR, which also accounts for collateral pledged with the loans (for further details on the indicators, see the statistical paper and technical annex).
Looking ahead, we plan to regularly update our datasets with the latest information from climate models. We will also continue refining the methodologies, enhancing the alignment between climate science and decision-making in the financial sector.
Chart 3
Enhanced windstorm dataset and its impact on the expected loss indicators
|
a) Wind speed (m/s), 100-year return period |
b) Expected loss indicators: NEAR and CEAR for loan portfolios of euro area banks |
|---|---|
| (m/s) | (EUR billions) |

 |
 |
Sources: ESCB calculations based on data from AnaCredit, RIAD, and Copernicus (Windstorm Information Centre and Enhanced Windstorm Service).
Notes: Portfolio exposures cover loan portfolios of euro area financial institutions vis-a-vis non-financial corporations. For more information, please refer to the statistical paper and the technical annex. Expected loss indicators are based on loan portfolios, with the December 2022 reference period for the WISC indicator and December 2024 for the EWS indicators.
Statistical methods bridge data gaps
Thanks to harmonised methodology and data sources, the climate indicators ensure consistency and comparability across the euro area. That addresses a key requirement of data users and policymakers. As sustainability reporting remains limited, this effort demonstrates how leveraging statistical techniques can bridge data gaps as we wait for gradual improvements in available data. The work will continue, incorporating advancements in climate and statistical modelling, as well as new data sources.
The views expressed in each blog entry are those of the author(s) and do not necessarily represent the views of the European Central Bank and the Eurosystem.
Check out The ECB Blog and subscribe for future posts.
For topics relating to banking supervision, why not have a look at The Supervision Blog?

