Euro area job vacancy rate at 2.5%
Overview
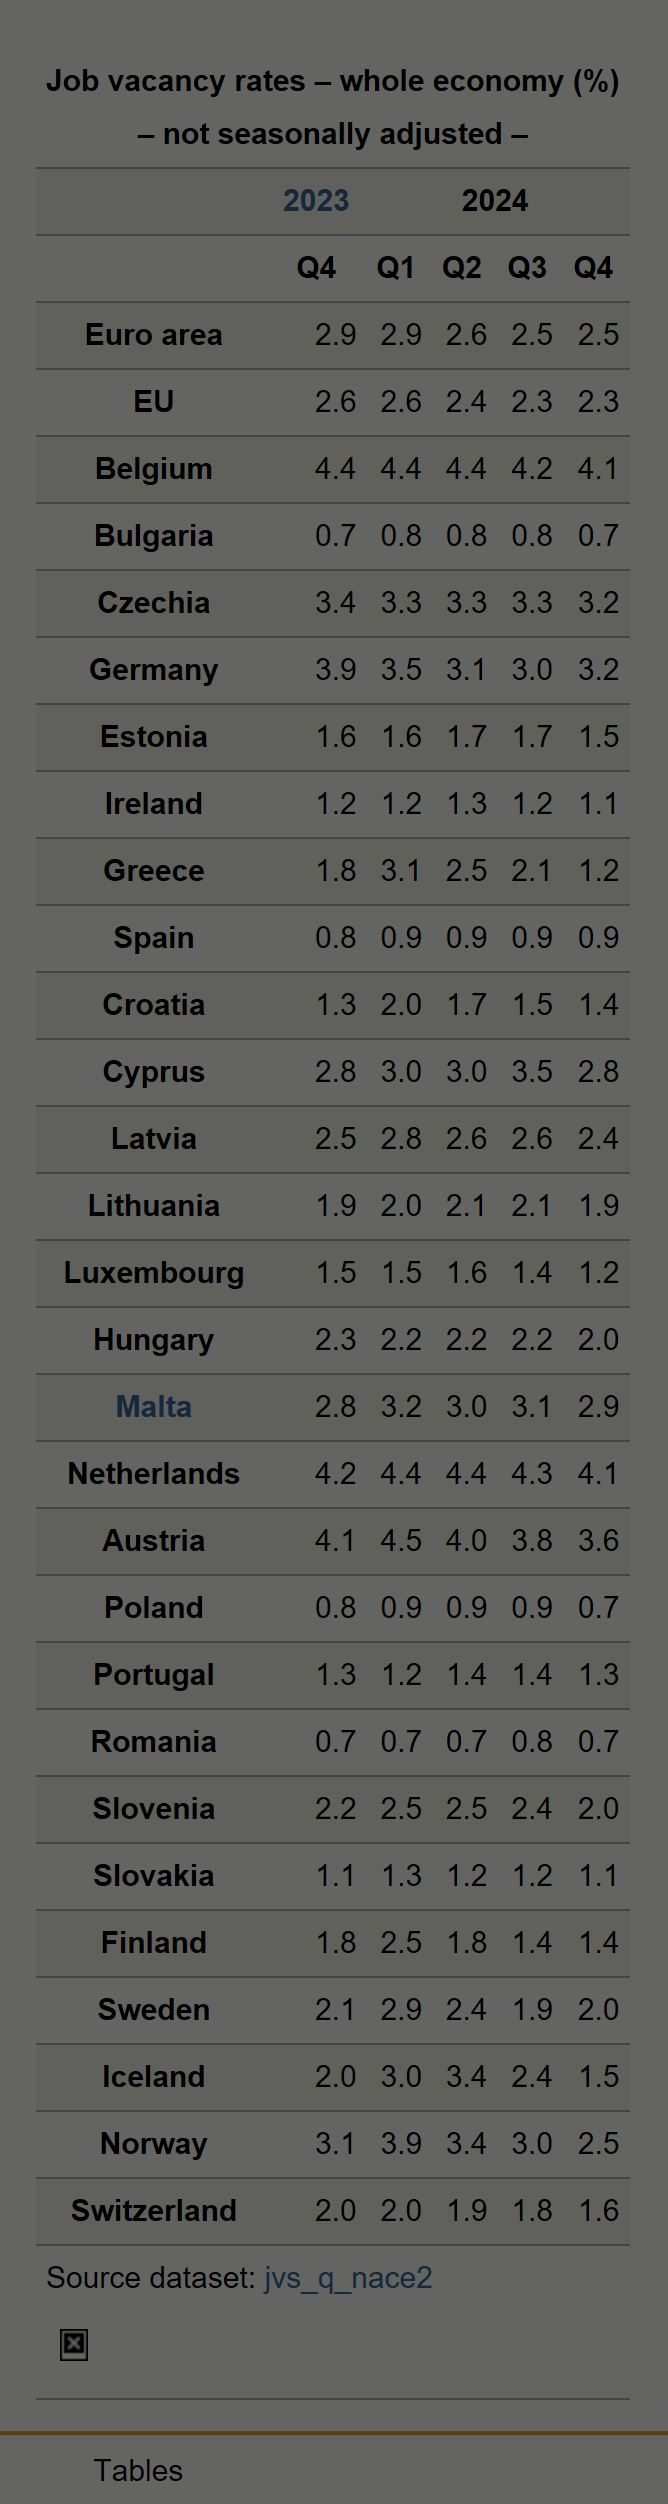
In the fourth quarter of 2024, the job vacancy rate was 2.5% in the euro area, unchanged from the third quarter of 2024 and down from 2.9% in the fourth quarter of 2023, according to figures published by Eurostat, the statistical office of the European Union. The job vacancy rate in the EU was 2.3% in the fourth quarter of 2024, the same as in the third quarter of 2024 and down from 2.6% in the fourth quarter of 2023.

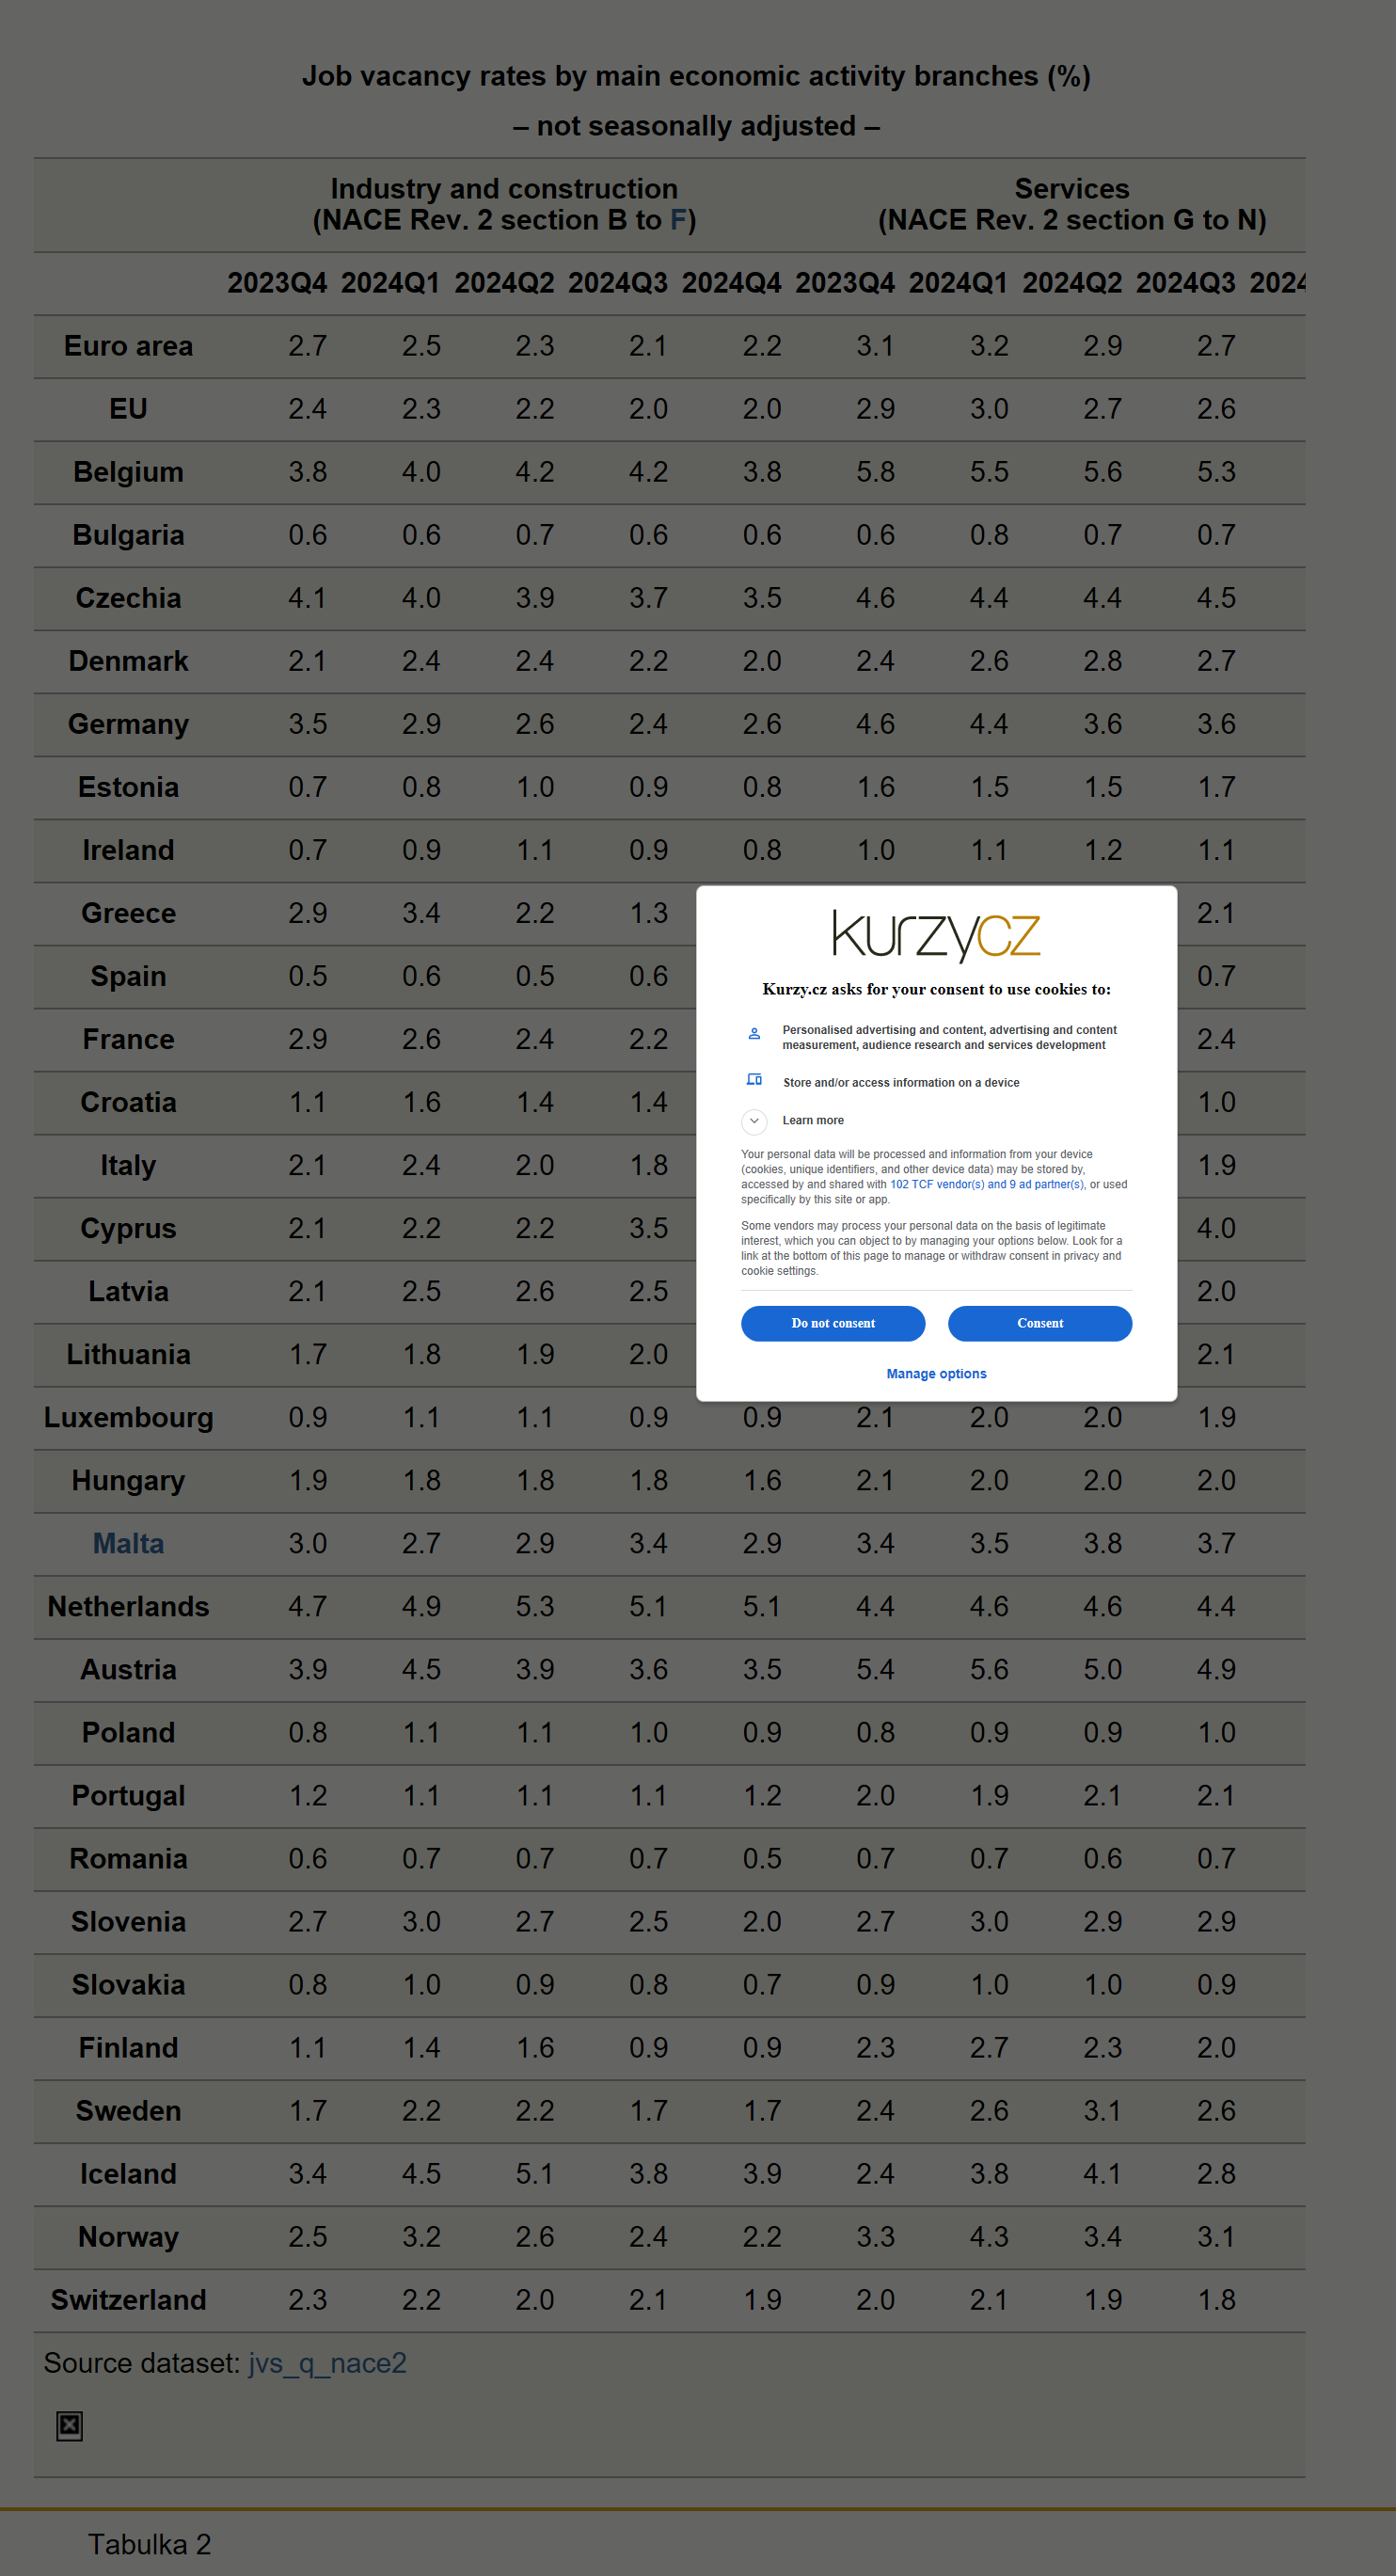
In the euro area, the job vacancy rate in the fourth quarter of 2024 was
-
2.2% in industry and construction, and
-
2.7% in services.
In the EU, the rate was
-
2.0% in industry and construction, and
-
2.5% in services.
Job vacancy rate by Member States
Among the Member States for which comparable data are available (see country notes), the highest job vacancy rates in the fourth quarter of 2024 were recorded in Belgium and in the Netherlands (4.1% in both of them), followed by Austria (3.6%). By contrast, the lowest rates were observed in Bulgaria, Poland, and Romania (0.7% in all of them), followed by Spain (0.9%).

Compared with the same quarter of the previous year, the job vacancy rate increased in four Member States, remained stable in six Member States and decreased in seventeen Member States. The largest increases were observed in Denmark, Spain, Croatia, and Malta (+0.1 pp). The largest decreases were recorded in Germany (-0.7 pp), Greece (-0.6 pp), France and Austria (both -0.5 pp).
Breakdown by economic activity
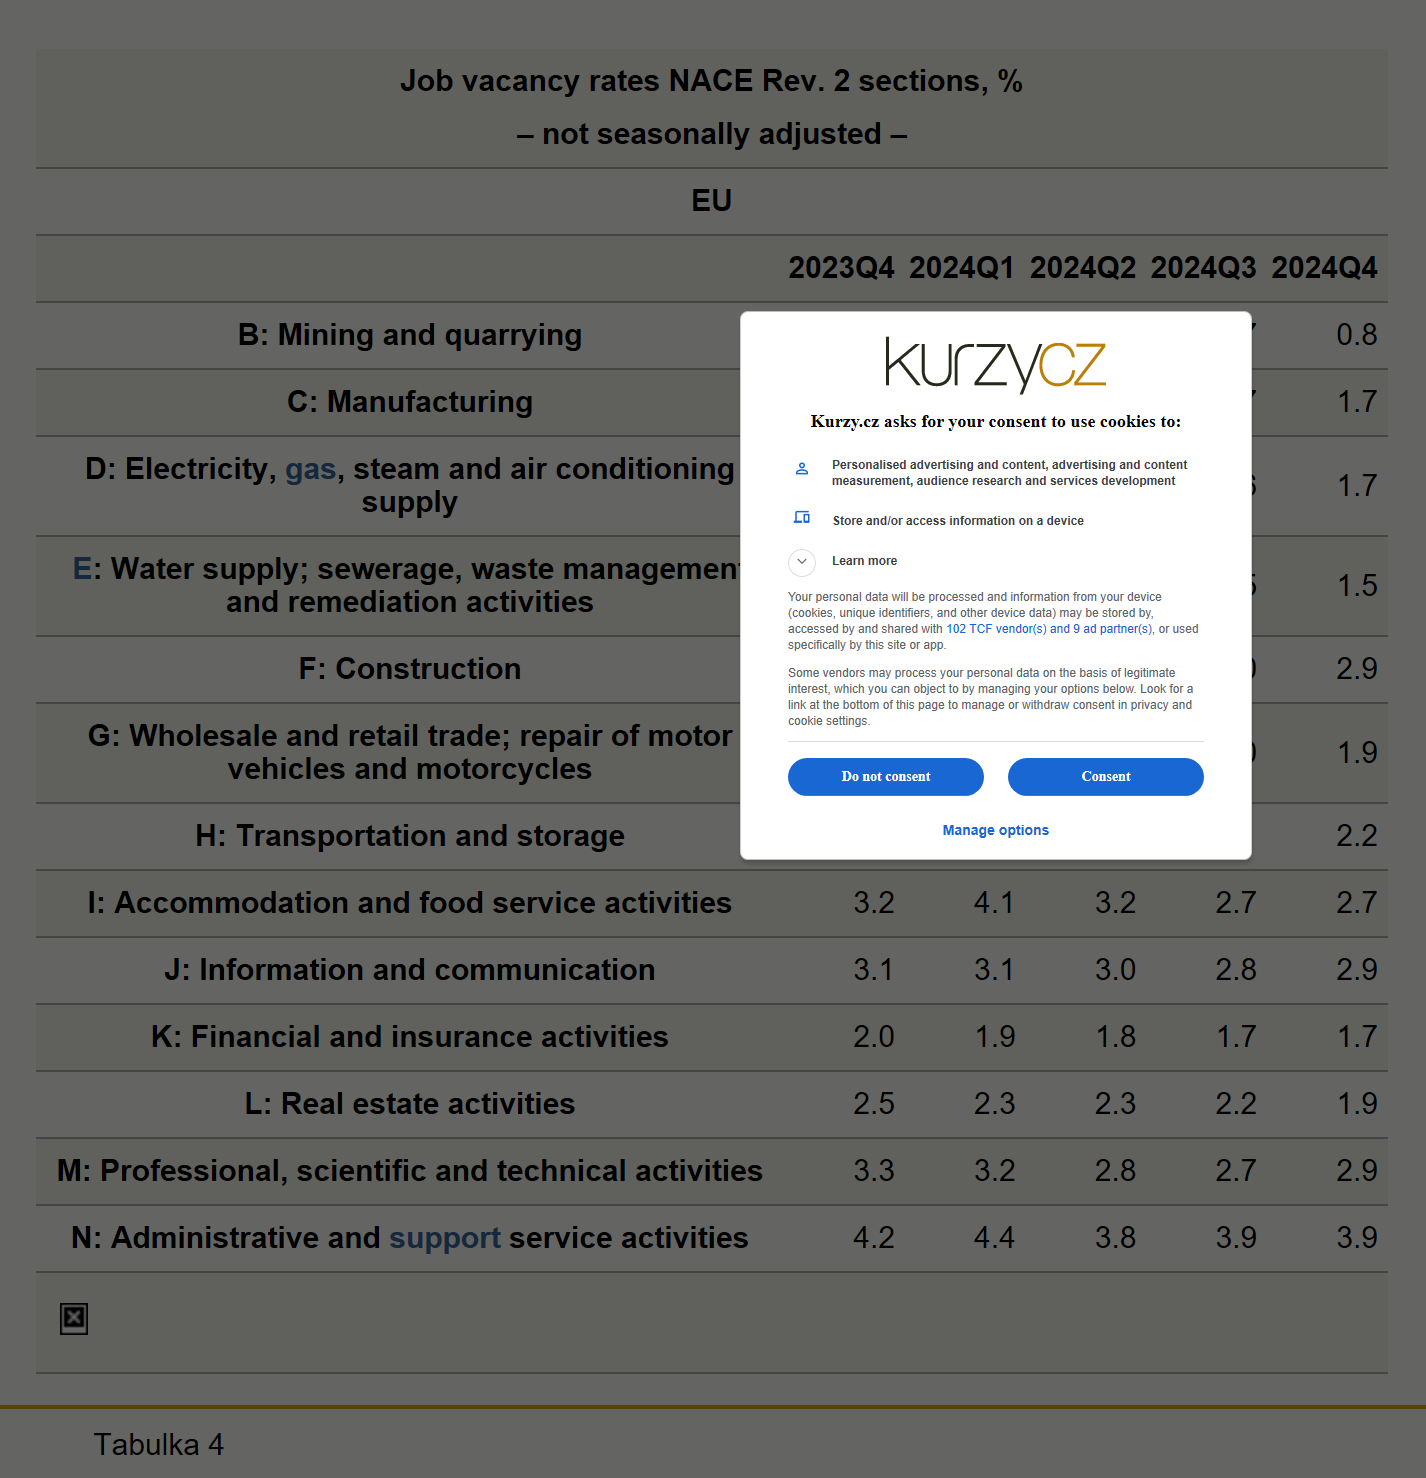
The figure below presents the job vacancy rates of the euro area and the EU by economic activity, in the fourth quarter of 2024. Data are displayed for the business economy, for which data are available from all EU countries. The highest job vacancy rates, for the euro area and the EU, respectively, were recorded in:
-
Section N: "Administrative and support service activities" that includes temporary employment agencies (4.1% in the euro area, 3.9% in the EU),
-
Section F: "Construction" (3.2% in the euro area, 2.9% in the EU),
-
Section J: "Information and communication" (3.2% in the euro area, 2.9% in the EU),
-
Section M: "Professional, scientific and technical activities" (3.1% in the euro area, 2.9% in the EU), and
-
Section I: "Accommodation and food service activities" (2.8% in the euro area, 2.7% in the EU).

Tables
|
Job vacancy rates – whole economy (%) – not seasonally adjusted – |
|||||
|---|---|---|---|---|---|
|
2024 |
|||||
|
Q4 |
Q1 |
Q2 |
Q3 |
Q4 |
|
|
Euro area |
2.9 | 2.9 | 2.6 | 2.5 | 2.5 |
|
EU |
2.6 | 2.6 | 2.4 | 2.3 | 2.3 |
|
Belgium |
4.4 | 4.4 | 4.4 | 4.2 | 4.1 |
|
Bulgaria |
0.7 | 0.8 | 0.8 | 0.8 | 0.7 |
|
Czechia |
3.4 | 3.3 | 3.3 | 3.3 | 3.2 |
|
Germany |
3.9 | 3.5 | 3.1 | 3.0 | 3.2 |
|
Estonia |
1.6 | 1.6 | 1.7 | 1.7 | 1.5 |
|
Ireland |
1.2 | 1.2 | 1.3 | 1.2 | 1.1 |
|
Greece |
1.8 | 3.1 | 2.5 | 2.1 | 1.2 |
|
Spain |
0.8 | 0.9 | 0.9 | 0.9 | 0.9 |
|
Croatia |
1.3 | 2.0 | 1.7 | 1.5 | 1.4 |
|
Cyprus |
2.8 | 3.0 | 3.0 | 3.5 | 2.8 |
|
Latvia |
2.5 | 2.8 | 2.6 | 2.6 | 2.4 |
|
Lithuania |
1.9 | 2.0 | 2.1 | 2.1 | 1.9 |
|
Luxembourg |
1.5 | 1.5 | 1.6 | 1.4 | 1.2 |
|
Hungary |
2.3 | 2.2 | 2.2 | 2.2 | 2.0 |
| 2.8 | 3.2 | 3.0 | 3.1 | 2.9 | |
|
Netherlands |
4.2 | 4.4 | 4.4 | 4.3 | 4.1 |
|
Austria |
4.1 | 4.5 | 4.0 | 3.8 | 3.6 |
|
Poland |
0.8 | 0.9 | 0.9 | 0.9 | 0.7 |
|
Portugal |
1.3 | 1.2 | 1.4 | 1.4 | 1.3 |
|
Romania |
0.7 | 0.7 | 0.7 | 0.8 | 0.7 |
|
Slovenia |
2.2 | 2.5 | 2.5 | 2.4 | 2.0 |
|
Slovakia |
1.1 | 1.3 | 1.2 | 1.2 | 1.1 |
|
Finland |
1.8 | 2.5 | 1.8 | 1.4 | 1.4 |
|
Sweden |
2.1 | 2.9 | 2.4 | 1.9 | 2.0 |
|
Iceland |
2.0 | 3.0 | 3.4 | 2.4 | 1.5 |
|
Norway |
3.1 | 3.9 | 3.4 | 3.0 | 2.5 |
|
Switzerland |
2.0 | 2.0 | 1.9 | 1.8 | 1.6 |
|
Source dataset: jvs_q_nace2
|
|||||

|
Job vacancy rates – restricted coverage* (%) – not seasonally adjusted – |
|||||
|---|---|---|---|---|---|
|
2023 |
2024 |
||||
|
Q4 |
Q1 |
Q2 |
Q3 |
Q4 |
|
|
Denmark |
2.3 | 2.5 | 2.7 | 2.5 | 2.4 |
|
France |
3.0 | 2.8 | 2.8 | 2.5 | 2.5 |
|
Italy |
1.9 | 2.5 | 2.1 | 1.9 | 1.7 |
|
* see "Country notes" Source dataset: jvs_q_nace2
|
|||||
|
Job vacancy rates by main economic activity branches (%) – not seasonally adjusted – |
||||||||||
|---|---|---|---|---|---|---|---|---|---|---|
|
Industry and construction
|
Services
|
|||||||||
|
2023Q4 |
2024Q1 |
2024Q2 |
2024Q3 |
2024Q4 |
2023Q4 |
2024Q1 |
2024Q2 |
2024Q3 |
2024Q4 |
|
|
Euro area |
2.7 | 2.5 | 2.3 | 2.1 | 2.2 | 3.1 | 3.2 | 2.9 | 2.7 | 2.7 |
|
EU |
2.4 | 2.3 | 2.2 | 2.0 | 2.0 | 2.9 | 3.0 | 2.7 | 2.6 | 2.5 |
|
Belgium |
3.8 | 4.0 | 4.2 | 4.2 | 3.8 | 5.8 | 5.5 | 5.6 | 5.3 | 5.4 |
|
Bulgaria |
0.6 | 0.6 | 0.7 | 0.6 | 0.6 | 0.6 | 0.8 | 0.7 | 0.7 | 0.7 |
|
Czechia |
4.1 | 4.0 | 3.9 | 3.7 | 3.5 | 4.6 | 4.4 | 4.4 | 4.5 | 4.7 |
|
Denmark |
2.1 | 2.4 | 2.4 | 2.2 | 2.0 | 2.4 | 2.6 | 2.8 | 2.7 | 2.5 |
|
Germany |
3.5 | 2.9 | 2.6 | 2.4 | 2.6 | 4.6 | 4.4 | 3.6 | 3.6 | 3.9 |
|
Estonia |
0.7 | 0.8 | 1.0 | 0.9 | 0.8 | 1.6 | 1.5 | 1.5 | 1.7 | 1.7 |
|
Ireland |
0.7 | 0.9 | 1.1 | 0.9 | 0.8 | 1.0 | 1.1 | 1.2 | 1.1 | 0.9 |
|
Greece |
2.9 | 3.4 | 2.2 | 1.3 | 1.2 | 1.9 | 4.3 | 3.3 | 2.1 | 1.4 |
|
Spain |
0.5 | 0.6 | 0.5 | 0.6 | 0.5 | 0.7 | 0.7 | 0.7 | 0.7 | 0.7 |
|
France |
2.9 | 2.6 | 2.4 | 2.2 | 2.2 | 2.9 | 2.8 | 2.7 | 2.4 | 2.4 |
|
Croatia |
1.1 | 1.6 | 1.4 | 1.4 | 1.1 | 1.0 | 1.8 | 1.5 | 1.0 | 1.0 |
|
Italy |
2.1 | 2.4 | 2.0 | 1.8 | 1.8 | 1.8 | 2.7 | 2.2 | 1.9 | 1.7 |
|
Cyprus |
2.1 | 2.2 | 2.2 | 3.5 | 2.4 | 3.2 | 3.8 | 3.8 | 4.0 | 3.3 |
|
Latvia |
2.1 | 2.5 | 2.6 | 2.5 | 2.2 | 2.1 | 2.4 | 2.1 | 2.0 | 1.9 |
|
Lithuania |
1.7 | 1.8 | 1.9 | 2.0 | 1.7 | 1.9 | 1.9 | 2.0 | 2.1 | 2.0 |
|
Luxembourg |
0.9 | 1.1 | 1.1 | 0.9 | 0.9 | 2.1 | 2.0 | 2.0 | 1.9 | 1.6 |
|
Hungary |
1.9 | 1.8 | 1.8 | 1.8 | 1.6 | 2.1 | 2.0 | 2.0 | 2.0 | 1.8 |
| 3.0 | 2.7 | 2.9 | 3.4 | 2.9 | 3.4 | 3.5 | 3.8 | 3.7 | 3.5 | |
|
Netherlands |
4.7 | 4.9 | 5.3 | 5.1 | 5.1 | 4.4 | 4.6 | 4.6 | 4.4 | 4.2 |
|
Austria |
3.9 | 4.5 | 3.9 | 3.6 | 3.5 | 5.4 | 5.6 | 5.0 | 4.9 | 4.4 |
|
Poland |
0.8 | 1.1 | 1.1 | 1.0 | 0.9 | 0.8 | 0.9 | 0.9 | 1.0 | 0.7 |
|
Portugal |
1.2 | 1.1 | 1.1 | 1.1 | 1.2 | 2.0 | 1.9 | 2.1 | 2.1 | 1.8 |
|
Romania |
0.6 | 0.7 | 0.7 | 0.7 | 0.5 | 0.7 | 0.7 | 0.6 | 0.7 | 0.7 |
|
Slovenia |
2.7 | 3.0 | 2.7 | 2.5 | 2.0 | 2.7 | 3.0 | 2.9 | 2.9 | 2.6 |
|
Slovakia |
0.8 | 1.0 | 0.9 | 0.8 | 0.7 | 0.9 | 1.0 | 1.0 | 0.9 | 0.8 |
|
Finland |
1.1 | 1.4 | 1.6 | 0.9 | 0.9 | 2.3 | 2.7 | 2.3 | 2.0 | 1.8 |
|
Sweden |
1.7 | 2.2 | 2.2 | 1.7 | 1.7 | 2.4 | 2.6 | 3.1 | 2.6 | 2.8 |
|
Iceland |
3.4 | 4.5 | 5.1 | 3.8 | 3.9 | 2.4 | 3.8 | 4.1 | 2.8 | 1.4 |
|
Norway |
2.5 | 3.2 | 2.6 | 2.4 | 2.2 | 3.3 | 4.3 | 3.4 | 3.1 | 2.6 |
|
Switzerland |
2.3 | 2.2 | 2.0 | 2.1 | 1.9 | 2.0 | 2.1 | 1.9 | 1.8 | 1.7 |
|
Source dataset: jvs_q_nace2
|
||||||||||
|
Job vacancy rates NACE Rev. 2 sections, % – not seasonally adjusted – |
|||||
|---|---|---|---|---|---|
|
Euro area |
|||||
|
2023Q4 |
2024Q1 |
2024Q2 |
2024Q3 |
2024Q4 |
|
|
B: Mining and quarrying |
1.5 | 1.7 | 1.4 | 1.1 | 1.3 |
|
C: Manufacturing |
2.2 | 2.0 | 1.9 | 1.8 | 1.8 |
|
D: Electricity, gas, steam and air conditioning supply |
2.1 | 2.0 | 1.8 | 1.7 | 1.9 |
|
E: Water supply; sewerage, waste management and remediation activities |
1.9 | 2.1 | 1.7 | 1.6 | 1.7 |
|
F: Construction |
4.1 | 3.9 | 3.5 | 3.2 | 3.2 |
|
G: Wholesale and retail trade; repair of motor vehicles and motorcycles |
2.6 | 2.6 | 2.4 | 2.2 | 2.1 |
|
H: Transportation and storage |
2.5 | 2.2 | 2.2 | 2.2 | 2.3 |
|
I: Accommodation and food service activities |
3.4 | 4.4 | 3.3 | 2.8 | 2.8 |
|
J: Information and communication |
3.4 | 3.4 | 3.2 | 3.0 | 3.2 |
|
K: Financial and insurance activities |
2.2 | 2.1 | 2.0 | 1.8 | 1.9 |
|
L: Real estate activities |
2.6 | 2.4 | 2.3 | 2.1 | 1.8 |
|
M: Professional, scientific and technical activities |
3.5 | 3.4 | 3.0 | 2.9 | 3.1 |
|
N: Administrative and support service activities |
4.5 | 4.7 | 3.9 | 4.1 | 4.1 |
|
|
|||||
|
Job vacancy rates NACE Rev. 2 sections, % – not seasonally adjusted – |
|||||
|---|---|---|---|---|---|
|
EU |
|||||
|
2023Q4 |
2024Q1 |
2024Q2 |
2024Q3 |
2024Q4 |
|
|
B: Mining and quarrying |
1.0 | 1.1 | 0.8 | 0.7 | 0.8 |
|
C: Manufacturing |
2.0 | 1.9 | 1.8 | 1.7 | 1.7 |
|
D: Electricity, gas, steam and air conditioning supply |
1.9 | 1.9 | 1.6 | 1.6 | 1.7 |
|
E: Water supply; sewerage, waste management and remediation activities |
1.7 | 1.8 | 1.6 | 1.5 | 1.5 |
|
F: Construction |
3.6 | 3.5 | 3.2 | 3.0 | 2.9 |
|
G: Wholesale and retail trade; repair of motor vehicles and motorcycles |
2.3 | 2.3 | 2.2 | 2.0 | 1.9 |
|
H: Transportation and storage |
2.3 | 2.1 | 2.2 | 2.1 | 2.2 |
|
I: Accommodation and food service activities |
3.2 | 4.1 | 3.2 | 2.7 | 2.7 |
|
J: Information and communication |
3.1 | 3.1 | 3.0 | 2.8 | 2.9 |
|
K: Financial and insurance activities |
2.0 | 1.9 | 1.8 | 1.7 | 1.7 |
|
L: Real estate activities |
2.5 | 2.3 | 2.3 | 2.2 | 1.9 |
|
M: Professional, scientific and technical activities |
3.3 | 3.2 | 2.8 | 2.7 | 2.9 |
|
N: Administrative and support service activities |
4.2 | 4.4 | 3.8 | 3.9 | 3.9 |
|
|
|||||
Notes for users
Revisions and timetable
Compared with the rates published in the News Release of 16 December 2024, the job vacancy rate for the third quarter of 2024 remained the same, both for the euro area and for the EU.
Country notes
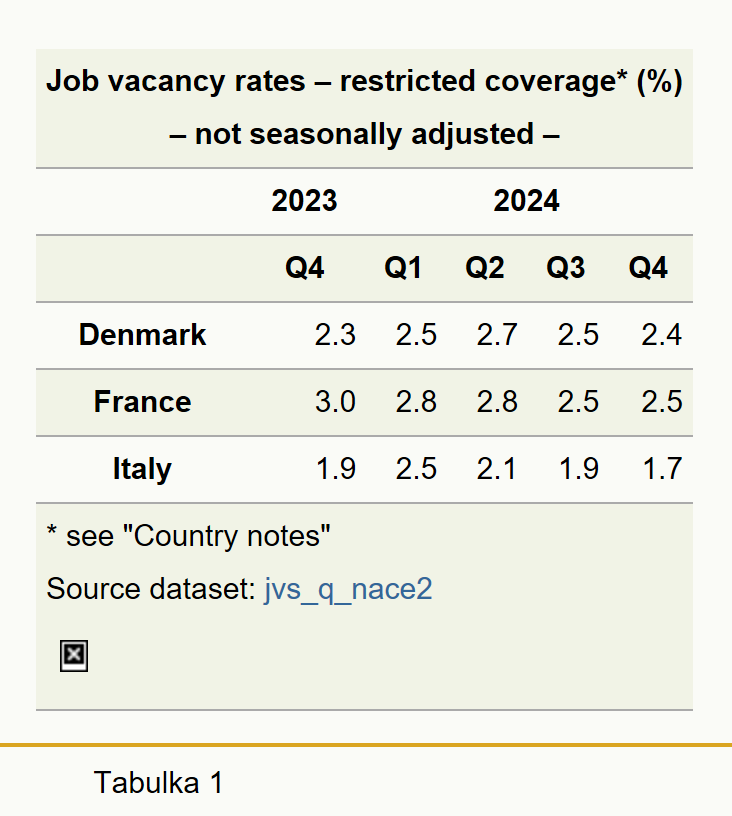
Denmark, France and Italy: data are not strictly comparable. In Denmark, only units within the business economy (NACE Rev. 2 sections B to N) are surveyed. In France and Italy, ‘Public administration and defence; compulsory social security” (NACE Rev. 2 section O) is not surveyed while public institutions are not fully covered in ‘Education’ as well as ‘Human health and social work activities’ (NACE Rev. 2 sections P and Q).
Methods and definitions
The job vacancy rate (JVR) measures the proportion of total posts that are vacant, expressed as a percentage:
JVR = (number of job vacancies) / (number of occupied posts + number of job vacancies).
A job vacancy is defined as a paid post (newly created, unoccupied or about to become vacant) for which the employer is taking active steps to find a suitable candidate from outside the enterprise concerned and is prepared to take more steps and which the employer intends to fill either immediately or in the near future. Under this definition, a job vacancy should be open to candidates from outside an enterprise. However, this does not exclude the possibility of the employer recruiting an internal candidate for the post. A vacant post that is open only to internal candidates should not be treated as a job vacancy. An occupied post is a paid post within an organisation to which an employee has been assigned.
Job vacancy rates cover NACE Rev. 2 sections B to S. This aggregate is referred to as “Whole economy” for the sake of simplification, even if sections A: ‘Agriculture, forestry and fishing’, T: ‘Activities of households as employers; undifferentiated goods and services producing activities of households for own use’ and U: ‘Activities of extraterritorial organisations and bodies’ are excluded. Sections B to S include the industry (B to E), construction (F) and services (G to N) sectors together with (mainly) non-market services (O to S).
The job vacancy rates for the EU and euro area aggregates are based on Member States data, including estimates for recent periods when values are not yet available. If national data are only available for a sub-population, for example excluding smaller units or some activities, this sub-population is used in the computation of the job vacancy rate for the aggregates.
Geographical information
Euro area (EA20): Belgium, Germany, Estonia, Ireland, Greece, Spain, France, Croatia, Italy, Cyprus, Latvia, Lithuania, Luxembourg, Malta, the Netherlands, Austria, Portugal, Slovenia, Slovakia and Finland.
European Union (EU27): Belgium, Bulgaria, Czechia, Denmark, Germany, Estonia, Ireland, Greece, Spain, France, Croatia, Italy, Cyprus, Latvia, Lithuania, Luxembourg, Hungary, Malta, the Netherlands, Austria, Poland, Portugal, Romania, Slovenia, Slovakia, Finland and Sweden.
For more information
Get in touch
Further information on data
Ksenia CANO
Phone: (+352) 4301-37 395
E-mail: ksenia.cano@ec.europa.eu
Sofie HOMA
Phone: (+352) 4301-31842
E-mail: Sofie.HOMA@ec.europa.eu


