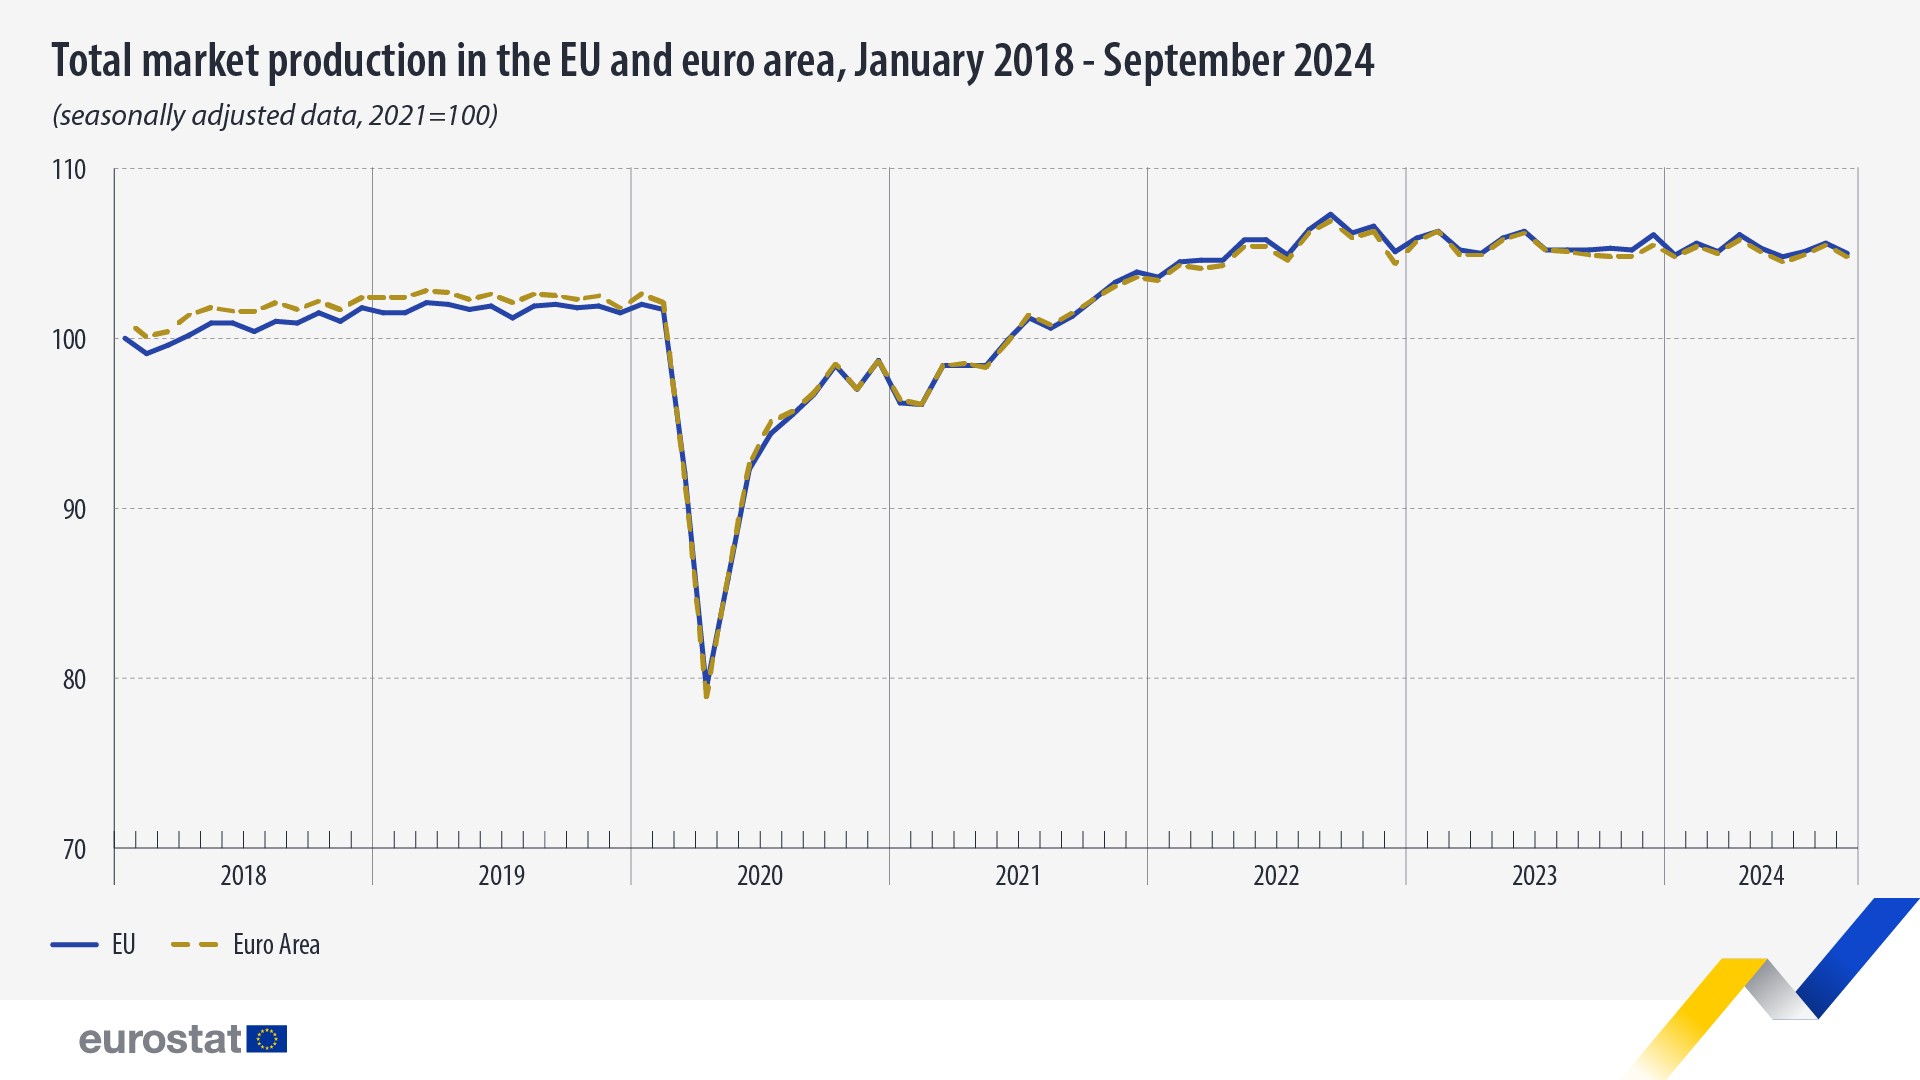
Total market production decreased by 0.6% in the EU and by 0.7% in the euro area monthly in September 2024

In September 2024, the total market production decreased by 0.6% in the EU and by 0.7% in the euro area compared with the previous month.
The total market production index (TMPI) is a composite indicator that combines 4 short-term business statistics indicators covering most of the market economy, i.e. production in industry, construction, and services as well as the trade volume.
The decrease of total market production in the EU in September was driven by a decline in industrial production (-1.8%), services (-0.2%) and construction (-0.1%), while trade saw an increase (+0.3%).
Compared with the same month of the previous year, total market production decreased by 0.4% in both the EU and the euro area.
This information comes from data on market production published by Eurostat today.
Source dataset: sts_tot_prod_m
For more information
- Statistics Explained article on total market production (volume) index overview
- Thematic section on short-term business statistics
- Database on short-term business statistics
Methodological notes
-
The total market production index (TMPI) covers industry, construction, trade and services, i.e. it combines all areas currently covered by short-term statistics indicators under the European Business Statistics Regulation. In terms of NACE Rev. 2 (statistical classification of economic activities) the coverage of the TMPI includes:
- Industry: NACE sections B (mining and quarrying), C (manufacturing), D (electricity, gas, steam);
- Construction: NACE section F;
- Trade: NACE section G, i.e. trade and repair of motor vehicles (G45), wholesale trade (G46) and retail trade (G47);
- Services: divisions H (transport), I (accommodation and food services), J (information and communication), L (real estate activities), M (professional and technical services), N (business support services).
- The evolution of the TMPI and quarterly gross domestic product (GDP) is quite similar, although there are also differences that become more pronounced with increasing distance from the base year. Apart from the limited coverage of the TMPI, there are several other methodological reasons for the differences, those are also explained in the related Statistics Explained article.
If you have any queries, please visit our contact us page.

