Critical inputs from China: how vulnerable are European firms to supply shortages?
- THE ECB BLOG
Critical inputs from China: how vulnerable are European firms to supply shortages?
9 October 2024
By Dennis Essers, Laura Lebastard, Michele Mancini, Ludovic Panon and Jacopo Timini
China has been an important and reliable supplier of critical inputs for European industries for decades. But how vulnerable would our companies be if that suddenly stopped? The ECB Blog estimates the potential losses in value added for manufacturers in five countries.
China is the top provider of Foreign Critical Inputs (FCIs) to the EU’s industries. So what would happen if those critical supplies suddenly dry up? This ECB Blog post combines a model with firm-level customs data to estimate the magnitude of the potential shock for the economies of five euro area countries.
FCIs are items which European firms typically cannot provide themselves or whose production they have outsourced. Such imports are considered as critical for the EU if the inputs are difficult to substitute, high-tech products, and/or items that are vital for the green transition. The European Commission has a list of hundreds of such inputs, including strategic products such as microchips, turbine parts, optical equipment or chemical precursors to produce drugs and batteries for electric cars.[1] FCIs represent 17% of extra-EU imports. According to country-level trade data, in 2022 a third of FCIs imported by the EU from extra-EU countries came from China (Chart 1). For the EU, other relevant geopolitically distant suppliers of FCIs are Russia and Hong Kong.
Chart 1
Non-EU countries’ share of FCI imports to the EU and partner alignment
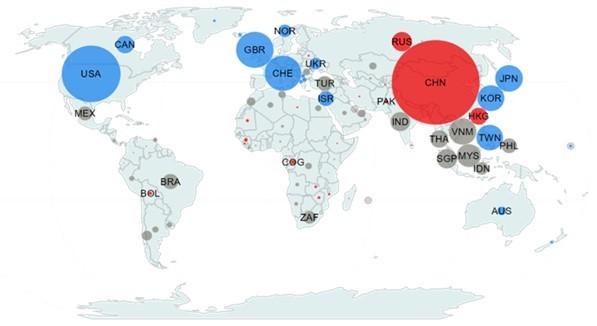
Notes: The size of the circles represents the relative share of each non-EU country’s exports of FCIs to the EU. Blue circles signal US-aligned countries, red circles China-aligned countries and grey circles neutral countries. The China bubble represents 30 percent and the US bubble represents 18 percent. International trade data are from the CEPII BACI dataset.
Aggregate impact of critical input supply disruption
We used firm-level trade and balance sheet data for five EU countries - Belgium, France, Italy, Slovenia and Spain - to shed quantitative light on the exposure to foreign supply risks.[2] We used a firm-level partial equilibrium model, based on a production function approach, to assess the short-term effect of disruptions to the supply of FCIs from China and other countries with a similar geopolitical orientation (i.e. China-aligned countries) on manufacturing value added. In the model, firms combine labour, capital, and intermediates, which are in turn produced using FCI and non-FCIs. Our baseline scenario consists of a sudden drop that halves the supply of FCIs from China-aligned countries. In line with business survey evidence, we assume that firms cannot substitute these inputs in the short run. Such FCI supply disruptions would generate a drop in manufacturing value added of 2.0% for Belgium, 2.5% for France, 2.9% for Spain and 3.1% for Italy and Slovenia in the short term (Chart 2). Large firms are driving the overall change, accounting for about 75% of the decline in value added in all countries. The results for the top 1% of firms display more heterogeneity, explaining about 15% of the decline in Italy and Spain, around 30% in France and Belgium, and more than 50% in Slovenia.
Chart 2
Decomposition of change in value added by size of firm involved
(percentage)
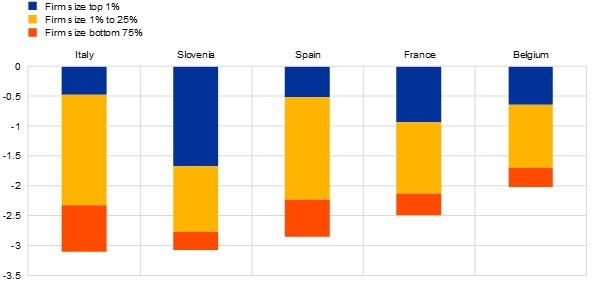
Notes: The chart reports the value-added change (in percentages) coming from a 50% drop in FCI supply from China-aligned countries. Firm size measured in value added (the percentile calculation only includes exposed firms). Only manufacturing firms are included.
What are the differences by sector and region?
The simulated impact is extremely heterogeneous across sectors. The electrical equipment industry stands out as the most affected sector, with a median value-added decline across countries of around 7%, more than double the overall median value-added decline of less than 3%. Other industries experiencing more than the median declines include chemicals, basic metals, electronics, and machinery (Chart 3). Together, these five industries account for nearly one-third of manufacturing value added in our countries. Some sectors, such as electronics, show a similar decline across countries, while in others such as chemicals and machinery the results vary much more from one country to another, reflecting different sub-sector compositions and firm-specific sourcing patterns.
Chart 3
Change in value added by sector across countries
(percentage)
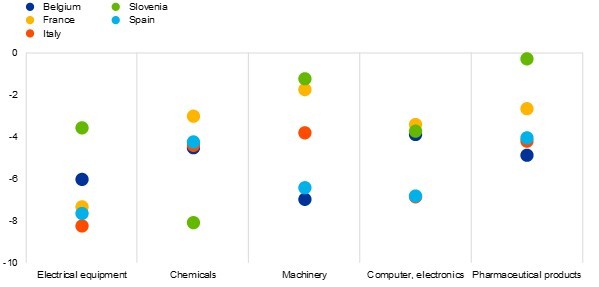
Notes: The chart reports the value-added change (in percentages) across the most exposed manufacturing sectors from a 50% drop in FCI supply from China-aligned countries.
Regional results are also very heterogeneous (Chart 4). The great heterogeneity across regions within countries is driven by specialisation and concentration. The most affected regions are those specialised in sectors heavily reliant on FCIs imported from non-EU countries. For instance, the Italian Marche region is relatively more specialised than other regions in the production of electrical equipment, which is an industry that heavily relies on sourcing foreign critical inputs from China-aligned countries. The concentration of top producers in some regions also contributes to this heterogeneity: the presence of large, exposed firms implies that their effect on the value added of their region is more substantial, which is consistent with the aggregate effects shown in Chart 2.
Chart 4
Change in manufacturing value added at the regional level
(percentage)
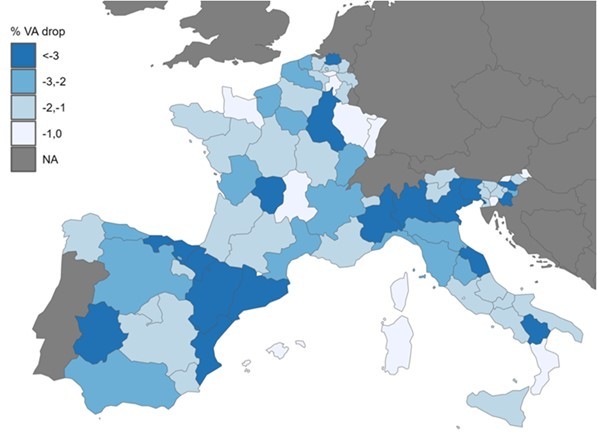
Notes: The chart reports the value-added change (in percentages) across regions coming from a 50% drop in FCI supply from China-aligned countries. Only manufacturing sectors are considered.
Conclusion
Identifying firms exposed to disruptions of critical inputs is key for policy makers to better prepare for forthcoming shocks with potential implications for growth and price stability. We argue that microdata are crucial not only for mapping strategic dependencies, but also for quantifying their importance in the event of a shock materialising. A deeper, more granular understanding of exposure to foreign dependencies would enhance our ability to pinpoint where and to what extent price pressures may arise, while also improving the assessment of economic and financial stability risks. At the same time, this insight will be essential in designing more effective industrial policies and reinforcing supply chain resilience. In this context, we support the call of Pichler et al. (2023) for “an alliance to map global supply networks”, emphasising the importance of collecting microdata and making them available for research purposes.[3] Our work is part of the European System of Central Banks’ (ESCB) effort to enhance its understanding of the ongoing geoeconomic trade fragmentation process. The forthcoming ESCB Report on Geoeconomic Trade Fragmentation, co-authored by about 40 researchers from nine national central banks and the ECB, will provide further analyses highlighting the need to look beyond aggregate trade data and improve the monitoring of detailed supply chains, including through increased cooperation among central banks and other international organisations.[4]
The views expressed in each blog entry are those of the authors and do not necessarily represent the views of the National Bank of Belgium, Bank of Italy, the Bank of Slovenia, the Bank of Spain, the European Central Bank and the Eurosystem.
Check out The ECB Blog and subscribe for future posts.
For topics relating to banking supervision, why not have a look at The Supervision Blog?
-
Arjona, R., W. Connell and Herghelegiu, C., (2023): “An enhanced methodology to monitor the EU’s strategic dependencies and vulnerabilities,” European Commission Single Market Economy Paper, 2023/14.
-
See Panon, L., Lebastard, L., Mancini, M., Borin, A., Caka, P., Cariola, G., Essers, D., Gentili, E., Linarello, A., Padellini, T., Requena, T. and Timini, J., (2024): "Inputs in distress: geoeconomic fragmentation and firms' sourcing", Banca d’Italia Occasional Papers, 861.
-
See Pichler, A., Diem, C., Brintrup, A., Lafond, F., Magerman, G., Buiten, G., Choi, T., Carvalho, V., Farmer, J. and Thurner, S., (2023): “Building an alliance to map global supply networks,” Science, 382, 270–272.
-
Attinasi M. G., Mancini, M. et al. (2024), Navigating a fragmenting global trading system: insights for central banks, ECB Occasional Paper, forthcoming.
Poslední zprávy z rubriky Makroekonomika:
Přečtěte si také:
Příbuzné stránky
- ARES - Administrativní registr ekonomických subjektů, informační registr
- Critical raw materials: MEPs back plans to secure EU's own supply and sovereignty
- Unipetrol - investors would announce how much they are willing to pay for company’s shares
- Coronavirus: €17.7 million from European Globalisation Adjustment Fund to support dismissed Air France workers
- Paradise lost? How crypto failed to deliver on its promises and what to do about it - Fabio Panetta
- Commission approves €450 million German measure to replace electricity generation amid Russian natural gas shortages - State aid
- Commission report finds labour and skills shortages persist and looks at possible ways to tackle them
- Global China Cash - aktuální a historické ceny kryptoměny Global China Cash, graf vývoje ceny kryptoměny Global China Cash - 2 dny - měna USD
- Global China Cash - aktuální a historické ceny kryptoměny Global China Cash, graf vývoje ceny kryptoměny Global China Cash - 2 roky - měna USD


Prezentace
14.11.2024 Dosáhne Bitcoin 100 000 USD do konce roku?
13.11.2024 Jaké je hlavní využití ekonomického kalendáře?
Okénko investora

Radoslav Jusko, Ronda Invest

Petr Lajsek, Purple Trading

Jakub Petruška, Zlaťáky.cz
S návratem Donalda Trumpa zlato prudce klesá. Trhy zachvátila pozitivní nálada

Miroslav Novák, AKCENTA

Olívia Lacenová, Wonderinterest Trading Ltd.
Starbucks v červených číslech: Přinese vize nového generálního ředitele oživení?

Mgr. Timur Barotov, BHS

Jiří Cimpel, Cimpel & Partneři
Portfolio 60/40: Nadčasová strategie pro dlouhodobé investory

Ali Daylami, BITmarkets
Trump vs. Harris: komu majitelé kryptoměn coby voliči dají radši hlas?

