Will the euro area car sector recover?
Will the euro area car sector recover?
Prepared by Roberto A. De Santis, Virginia Di Nino, Nina Furbach, Ulla Neumann and Pedro Neves
The automotive industry contributes a significant share to the value added of the euro area economy. The share of the car industry in the manufacturing sector’s real value added amounts to 10% and the share in real GDP is slightly below 2%. The car industry accounts for 1% of total euro area employment and 4% of extra-euro area exports. When inter-sectoral linkages are taken into account, the value added almost doubles, highlighting the sector’s extensive reach within the economy.[1] The resilience of the industry can be seen from its historical performance compared with aggregate GDP. Apart from during the global financial crisis and the most recent period, the sector had been expanding by more than aggregate GDP, reaching a peak in early 2018. Moreover, the sector has maintained a relatively stable share of total euro area employment since 2012 (Chart A).
Chart A
Size of the euro area automotive sector vis-a-vis the total economy
(percentages)
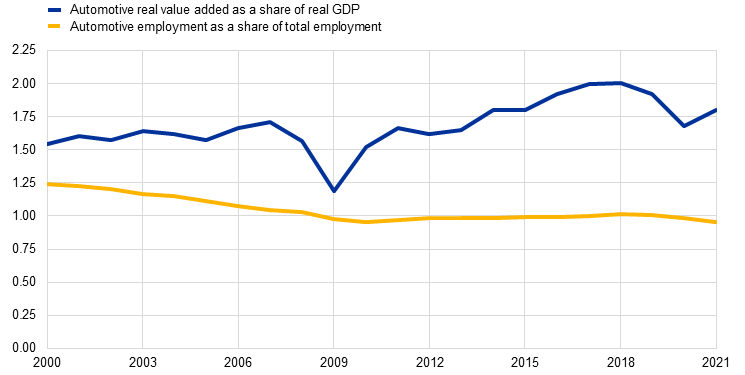
Sources: Eurostat and ECB calculations.
Note: The latest observation is for 2021.
However, since the peak in early 2018 the euro area automotive industry has faced significant challenges, with production and exports declining noticeably and remaining below pre-Covid levels. Production and export volumes have struggled to recover and lag those of international competitors, standing at around one-tenth below pre-Covid levels and one-fifth short of their peaks in early 2018 (Charts B and C). Competitors have fared much better: the automotive industry in countries like China, Japan, the United States and Korea has performed more robustly, with China gradually emerging as a significant exporter to the euro area.
Chart B
Car production volumes among global competitors
(12-month moving average, December 2017 = 100)
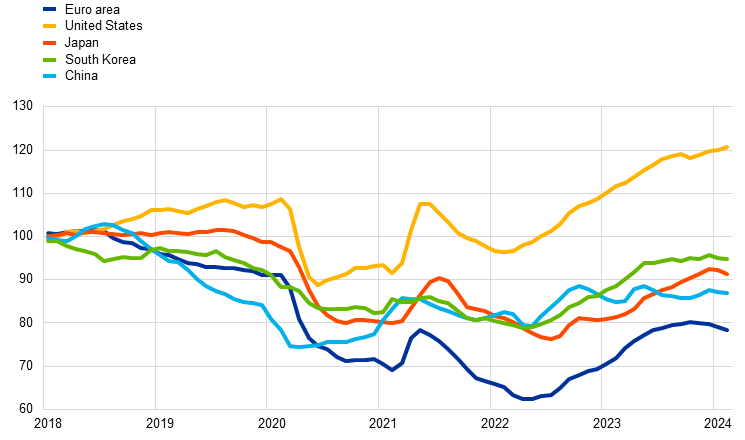
Sources: Eurostat, national statistical offices and ECB calculations.
Note: The latest observations are for February 2024.
Chart C
Car export volumes and import shares
(panel a: thousands of cars, 12-month moving average; panel b: percentage of domestic car demand)
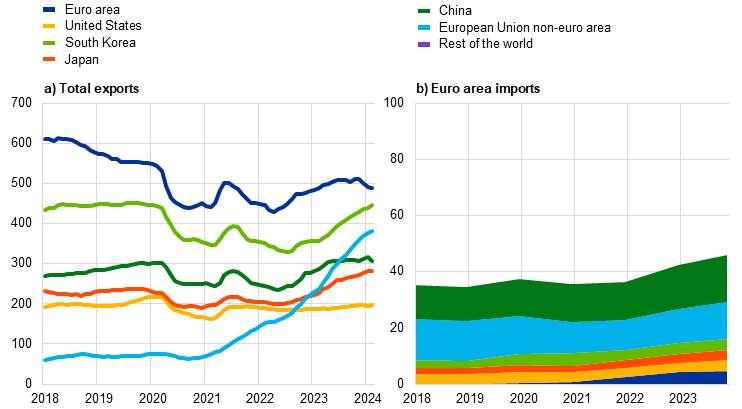
Sources: Trade Data Monitor, Eurostat, Statistical Office of the European Union and ECB calculations.
Notes: Export volumes are expressed in units of exported vehicles. The latest observations in panel a) are for January 2024 (and December 2023 for China) and in panel b) for 2023.
This decline in activity was triggered by a drop in sales of combustion engine cars, which was only partly offset by rising demand for hybrid and electric cars. EU regulatory standards for motor vehicles changed in mid-2018, enforcing stricter standards on carbon dioxide (CO2) emissions and more stringent emissions tests, which disincentivised the purchase of combustion cars. Sales of hybrid and electric vehicles steadily increased from one-tenth of total registrations in 2018 to half of total registrations by 2023 (Chart D). Euro area car registrations were around 20% lower in the first quarter of 2024 compared with the beginning of 2018 (Chart D). The significant disparity between car registrations and household consumption of durable goods, which remains relatively stable, suggests that households may be delaying the purchases of new vehicles of all types.
Chart D
Car registrations by type
(left-hand scale: index Q1 2018 = 100; right-hand scale: percentages of total registrations)
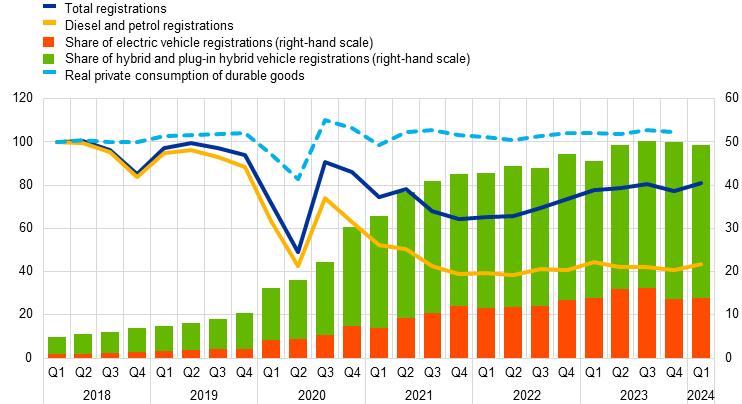
Sources: European Automobile Manufacturers' Association, Eurostat and ECB calculations.
Note: The latest observations are for the first quarter of 2024 and, for durable goods consumption, the fourth quarter of 2023.
Demand for motor vehicles has also been dampened by price increases triggered by supply chain disruptions, higher energy costs and tight financing conditions. The delivery time for auto components lengthened during the pandemic, particularly in the euro area, where production chains are highly globally integrated. In addition, since September 2021 spikes in energy prices have passed through to producer prices and final car prices.[2] Finally, the rise in interest rates resulting from the tightening of monetary policy has discouraged leasing and credit for car purchases, which lessened demand for both domestic and foreign cars.
Despite these challenges, the euro area has largely managed to defend its position in global markets by making a faster transition than its competitors towards electric and, in particular, hybrid vehicles. Exports in these segments have risen from low levels to account for more than one-third of total exported units today. Although the euro area has lost market share over the past few years, the decline in value terms has been relatively modest (a 2.5% reduction in terms of value since 2017).[3] Moreover, these losses solely concerned the traditional car segment and were partly offset by large gains in the hybrid and electric segments (Chart E). While China has made large inroads in the electric vehicle segment, so far this has mainly occurred for small and economical vehicles. The euro area has remained the second largest producer of electric and hybrid cars since 2020 and 2022 respectively. In addition, euro area carmakers have historically specialised in the high-end market segment, benefiting from a relatively price-inelastic demand.[4] In fact, euro area carmakers have remained highly profitable, consistently posting the highest net profit margins among their main global competitors in 2022 and 2023. This demonstrates the resilience of the euro area industry and its competitive edge in the global automotive market.
Chart E
Electric and hybrid car export volumes
(thousands of cars, 12-month moving average)
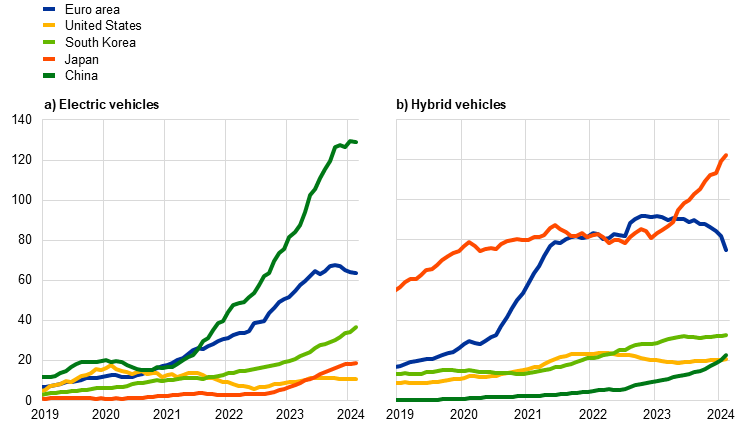
Sources: Trade Data Monitor and ECB calculations.
Notes: Export volumes are expressed as units of exported vehicles. The latest observations are for February 2024.
The resilience of the euro area automotive industry in the face of intensified competition from abroad is also reflected in its position as a global hub for automotive manufacturing. Despite challenges such as growing imports and import penetration[5] from China, the euro area seems to maintain a competitive advantage in transport equipment, as revealed by its favourable net trade balance.[6] In 2022 the euro area exported more of its transport equipment production to destinations worldwide than it received, highlighting its strength as an exporter (Chart F). Even with the growing presence of Chinese imports in the domestic market (Chart B) and China's dominance in global battery production, the euro area’s net trade balance in transport equipment with China remained positive, amounting to 3.8% of its industry’s domestic production.
Chart F
Global value added network in transport equipment in 2022
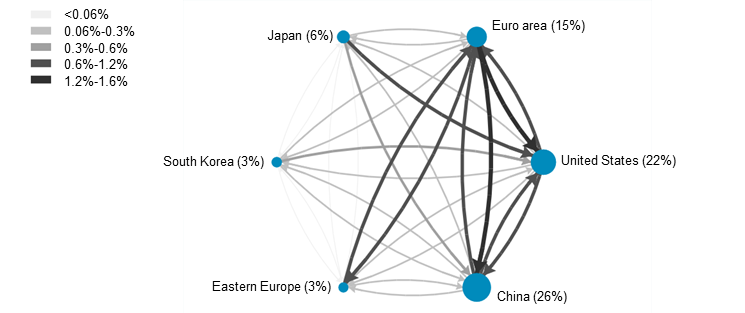
Sources: Multi-regional Input-output data and ECB calculations.
Notes: The size of the nodes is proportional to domestic value added in transport equipment in US dollars. The thickness of the arrows represents bilateral inflows and outflows of value added in transport equipment. Percentages displayed at the nodes and in the legend indicate the share of the respective value added relative to the total global value added of transport equipment.
Euro area car producers are investing substantial amounts in electrification and digital technologies to remain competitive in the rapidly evolving automotive market. This investment can be seen from significant capital expenditure (CAPEX) and research and development (R&D) expenditure, with euro area car producers accounting for approximately 20% and 30% globally in 2022 (Chart G). While China has emerged as a leader in CAPEX, euro area carmakers continue to lead in R&D investment, reflecting their commitment to innovation. This is demonstrated by the large number of new transport-related patents registered by euro area firms at the European Patent Office between 2020 and 2022, which exceed those registered by competitors. However, euro area firms are lagging behind in registrations of patents for digital communication, which signals the potential challenges facing the euro area automotive sector related to the digital transformation.
Chart G
Share of the automotive sector in CAPEX and R&D expenditure
(percentages, purchasing power parities)
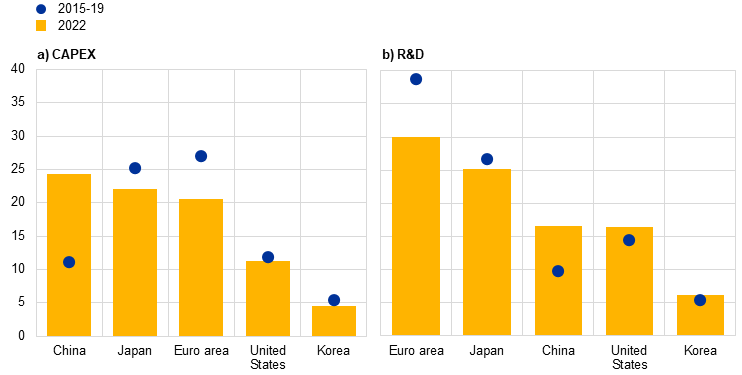
Sources: Reuters and ECB calculations.
In the medium term a recovery in euro area car production is expected to be primarily driven by consumer demand, but there are significant risks ahead. If obstacles to adopting electric cars weaken and as temporary shocks fade, domestic demand should recover. However, there are several important risks that could affect this outlook. The success of euro area carmakers in integrating digital processes with traditional ones, accelerating innovation and launching technologies that win market favour will be critical. Additionally, the heavy dependence of euro area carmakers on suppliers concentrated in a few locations (for instance, semiconductors and batteries produced in a small number of countries in Asia) poses risks to the supply chain, especially in times of heightened geopolitical tension. Efforts must be made to enhance resilience against supply chain disruptions and to diversify sources of strategic components to maintain competitiveness. Industrial policies, particularly those related to the green transition, such as charging infrastructure, will also shape the outlook for the euro area automotive sector.[7]
See the article entitled “Sectoral dynamics and the business cycle in the euro area” in this issue of the Economic Bulletin.
See the box entitled “Motor vehicle sector: explaining the drop in output and the rise in prices”, Economic Bulletin, issue 7, ECB, 2022, and De Santis, R. A., “Supply Chain Disruption and Energy Supply Shocks: Impact on Euro Area Output and Prices”, International Journal of Central Banking, 2024, Vol. 20, pp. 193-236.
See Schnabel, I., “The future of inflation (forecast) targeting”, speech at the International Research Forum on Monetary Policy, Federal Reserve Board, Washington, D.C., (slide 8), 17 April 2024.
Internal empirical analyses suggest that euro area exported units are less sensitive to changes in car prices compared with the exported units of other main global producers (Japan, United States and Korea) and significantly less sensitive than those of China.
Import penetration is measured by the ratio of imports to total domestic consumption.
Within transport equipment, motor vehicles, trailers and semi-trailers account for 76% of euro area exported value added and 89% of its net trade balance.
In 2021 the European Parliament approved a Regulation on the deployment of alternative fuels infrastructure, which prepares the ground for the adoption of EU green strategies. Similar initiatives include the Digital Vehicle Passport and Digital Battery Passport, which are aimed at enhancing transparency and sustainability in the automotive industry. The EU has also enacted legislation on battery recycling materials to drive the industry towards innovative and sustainable design and production methods. Additionally, the EU provides economic incentives like the Carbon Border Adjustment Mechanism, which imposes fees on carbon-intensive imports to reduce carbon leakage and encourage greener practices within the industry.

