Eurosystem staff macroeconomic projections for the euro area, June 2024
The euro area economy recovered at the start of 2024 by more than expected in the March 2024 ECB staff projections, with a boost from net trade and rising household spending. Incoming information suggests continued growth in the short run, at a higher pace than previously foreseen. Real disposable income should continue to increase, amid robust wage growth, gradually increasing confidence and improving terms of trade, giving rise to a consumption-driven recovery in the course of 2024. The boost from net trade at the start of the year partly reflects volatility following a temporary decline at the end of 2023. However, foreign demand is expected to continue to expand, supporting euro area export growth. Over the medium term, the negative impact of the past monetary policy tightening is seen to gradually fade, with activity supported by an assumed easing of financing conditions in line with market expectations for the future path of interest rates. Growth will also benefit from a resilient labour market, with the unemployment rate declining to historically low levels later on in the projection horizon. As some of the cyclical factors that have lowered productivity growth in the recent past unwind, productivity is expected to pick up over the projection horizon. Overall, annual average real GDP growth is expected to be 0.9% in 2024, and to strengthen to 1.4% in 2025 and 1.6% in 2026. Compared with the March 2024 projections, the outlook for GDP growth has been revised up for 2024, owing to the positive surprise at the start of the year and improved incoming information. The GDP growth outlook has been revised down marginally for 2025 and remains unchanged for 2026.[1]
Headline inflation is projected to move broadly sideways in the near term, before moderating further to levels close to target in the course of 2025. This reflects an easing of cost pressures, including from the labour side, and the lagged impact of past monetary policy tightening gradually feeding through to consumer prices. Headline inflation as measured by the Harmonised Index of Consumer Prices (HICP) is expected to show some volatility over the remainder of 2024 owing to base effects and higher energy commodity prices. Over the medium term, energy inflation should settle at low positive rates, given market expectations for the future paths of oil and gas prices and planned climate change-related fiscal measures. Recent quarters have seen food price inflation decline strongly, as pipeline pressures have eased with lower energy and food commodity prices. Looking ahead, food price inflation is expected to fluctuate around its current levels before moderating further from the end of 2025. HICP inflation excluding energy and food (HICPX) should remain above headline inflation for most of the projection horizon but is expected to continue its disinflationary path, although at a slow pace and mainly in 2025 and 2026. A central element in this projection is the expected gradual easing of nominal wage growth from initially still elevated levels as upward impacts from inflation compensation pressures in a tight labour market fade. The expected recovery in productivity growth should support the moderation in labour cost pressures. Moreover, profit growth is set to weaken and partially buffer the pass-through of labour costs to prices, especially in 2024. Overall, annual average headline HICP inflation is expected to decline from 5.4% in 2023 to 2.5% in 2024, 2.2% in 2025 and 1.9% in 2026. Compared with the March 2024 projections, HICP inflation has been revised up by 0.2 percentage points in 2024 and 2025. This is mainly due to higher energy commodity prices and slightly higher than expected incoming data for HICPX inflation. In addition, labour cost pressures are expected to be somewhat stronger on account of higher wage growth coupled with a slightly more cautious outlook for productivity growth. The outlook for both headline inflation and HICPX inflation for 2026 is unrevised.
Table 1
Growth and inflation projections for the euro area
(annual percentage changes, revisions in percentage points)
Notes: Real GDP figures refer to annual averages of seasonally and working day-adjusted data. Historical data may differ from the latest Eurostat publications owing to data releases after the cut-off date for the projections. Data are available for downloading, also at quarterly frequency, from the Macroeconomic Projection Database on the ECB’s website.
1 The international environment
Global activity shows signs of improvement, although headwinds to growth remain. Incoming data on global activity (excluding the euro area) confirm a very gradual improvement since the beginning of the year, with hard data aligning increasingly with the positive signal coming from soft data.[2] However, headwinds to global growth remain, including gradually cooling labour markets, further moderation in nominal wage growth and diminished excess savings in advanced economies. Past monetary policy tightening and elevated economic uncertainty amid geopolitical tensions are also still dampening growth. In China, consumer spending remains weak against the backdrop of a troubled residential real estate sector, whereas manufacturing activity and exports continue to drive economic growth. The outlook for global growth is broadly unchanged from the March 2024 projections; growth of 3.3% is expected in 2024 and 2025, with 3.2% in 2026 – slightly below the pace observed over the last decade (Table 2).
Table 2
The international environment
(annual percentage changes, revisions in percentage points)
|
|
June 2024 |
Revisions vs March 2024 | ||||||
|---|---|---|---|---|---|---|---|---|
| World real GDP (excluding the euro area) | 3.5 | 3.3 | 3.3 | 3.2 | 0.0 | -0.1 | 0.1 | 0.0 |
|
Global trade (excluding the euro area)1) |
1.0 | 2.6 | 3.3 | 3.3 | -0.2 | -0.2 | 0.2 | 0.1 |
|
Euro area foreign demand2) |
0.8 | 2.1 | 3.4 | 3.3 | 0.2 | -0.3 | 0.3 | 0.1 |
| World CPI (excluding the euro area) | 5.0 | 4.2 | 3.3 | 2.9 | 0.1 | 0.1 | 0.1 | 0.1 |
|
Export prices of competitors in national currency3) |
-1.3 | 2.1 | 2.8 | 2.6 | -0.6 | -0.4 | 0.1 | 0.0 |
Note: Data are available for downloading, also at quarterly frequency, from the Macroeconomic Projection Database on the ECB’s website.
1) Calculated as a weighted average of imports.
2) Calculated as a weighted average of imports of euro area trading partners.
3) Calculated as a weighted average of the export deflators of euro area trading partners.
Global trade (excluding the euro area) is projected to recover this year and to grow more in line with global activity thereafter. Following a period of weak trade dynamics in 2023, with the post-pandemic rebalancing of demand from goods to services, incoming data confirm that the recovery in global trade is continuing unabated and the impact of traffic disruptions in the Red Sea area remains contained. Global imports are projected to increase by 2.6% in 2024, before rising to 3.3% in 2025 and 2026 – little changed compared with previous projections. The recovery in euro area foreign demand this year is expected to be less dynamic, at 2.1%. This largely reflects weaker imports in some of the euro area’s main trading partners – such as the United Kingdom and central and eastern European countries – in the second half of 2023 and in the first quarter of 2024. As its quarterly growth dynamics over the projection horizon are comparable with those of world imports, euro area foreign demand is expected to increase by 3.4% in 2025 and by 3.3% in 2026.
Inflation at the global level is projected to decline over the projection horizon. Headline consumer price index (CPI) inflation aggregated across major advanced and emerging market economies is expected to decline to 4.2% in 2024, 3.3% in 2025 and 2.9% in 2026, on account of the fading impacts of past supply shocks and restrictive monetary policy. While this outlook is broadly comparable with the March projections, inflation in the United States has been revised slightly upwards for this year owing to stronger than previously expected outturns in the first quarter. In China, headline CPI inflation remains subdued against the backdrop of sluggish domestic demand and is projected to increase gradually over the projection horizon. Growth in euro area competitor export prices, in national currency and annual terms, is expected to turn positive this year and to remain close to its estimated long-term average over the rest of the projection horizon. A downward revision for 2024 compared with the March projections reflects weaker than previously expected export price inflation outturns, outweighing the impact of higher commodity price assumptions in the current projection round.
Box 1
Technical assumptions
Compared with the March 2024 projections, the main changes to the technical assumptions are higher commodity prices, a stronger effective exchange rate (although slightly weaker against the US dollar) and slightly higher short-term interest rates. Energy price assumptions, based on futures prices, have been revised up (on average, over 2024-26, by 4% for oil and 5% for gas). Oil price assumptions based on futures remain in backwardation, falling by around 10% between 2024 and 2026, while gas prices are assumed to first rise in 2025 before falling back close to their 2024 levels. Overall, the level of energy prices at the end of 2026 is assumed to be around 30% above the level observed at the start of 2021. Prices of carbon emissions allowances on the EU Emissions Trading System have increased (by around 17%, on average, over 2024-26). Non-energy commodity prices have been revised up strongly on the back of higher international food commodity prices, especially for cocoa and coffee. The euro has depreciated slightly (by 0.3%) against the US dollar, reflecting the ongoing economic strength of the US economy and upward revisions to expectations of the Federal Open Market Committee’s interest rate path. However, in nominal effective terms the euro has appreciated (by 0.9%), driven by movements vis-a-vis the Japanese yen, the Swiss franc, the Swedish krona and, to a lesser extent, the pound sterling. While the slope of the EURIBOR forward curve remains strongly negative, assumptions for short-term interest rates have been revised up somewhat. The assumed paths for long-term interest rates are broadly unchanged.
Table
Technical assumptions
|
|
June 2024 |
Revisions vs March 2024 | ||||||
|---|---|---|---|---|---|---|---|---|
| Commodities: | ||||||||
| 83.7 | 83.8 | 78.0 | 74.5 | 0.0 | 5.1 | 4.1 | 3.1 | |
|
Natural gas prices (EUR/MWh) |
40.6 | 30.8 | 35.4 | 29.9 | 0.0 | 2.8 | 10.4 | 1.3 |
|
Wholesale electricity prices (EUR/MWh) |
103.5 | 73.0 | 87.7 | 72.8 | 0.6 | -1.9 | 12.0 | 2.1 |
| 83.7 | 66.1 | 71.1 | 73.6 | 0.0 | 12.8 | 18.5 | 19.0 | |
|
Non-energy commodity prices, in USD (annual percentage change) |
-12.5 | 11.4 | 3.9 | 0.9 | 0.0 | 10.8 | 1.9 | 0.8 |
| Exchange rates: | ||||||||
|
USD/EUR exchange rate |
1.08 | 1.08 | 1.08 | 1.08 | 0.0 | -0.2 | -0.3 | -0.3 |
|
Euro nominal effective exchange rate (EER41) (Q1 1999 = 100) |
121.8 | 124.0 | 124.2 | 124.2 | 0.0 | 0.7 | 0.9 | 0.9 |
| Financial assumptions: | ||||||||
|
Three-month EURIBOR (percentage per annum) |
3.4 | 3.6 | 2.8 | 2.5 | 0.0 | 0.2 | 0.4 | 0.1 |
|
Ten-year government bond yields (percentage per annum) |
3.1 | 2.9 | 3.0 | 3.0 | 0.0 | 0.0 | -0.1 | -0.1 |
Notes: The technical assumptions about euro area interest rates and commodity prices are based on market expectations, with a cut-off date of 15 May 2024. The assumptions for short-term interest rates are based on market expectations of the three-month EURIBOR, as implied in futures rates. Those for euro area ten-year nominal government bond yields are based on the average of countries’ ten-year bond yields, weighted by annual GDP figures. Where the necessary data exist, the country-specific ten-year nominal government bond yields are defined as the ten-year benchmark bond yields prolonged using the forward par yields derived, on the cut-off date, from the corresponding country-specific yield curves. For the other countries, the country-specific ten-year government bond yields are defined as the ten-year benchmark bond yield prolonged using a constant spread (observed on the cut-off date) over the technical euro area risk-free long-term interest rate assumption. The path of international commodity prices is implied by futures markets in the ten working days ending on the cut-off date. Oil prices refer to Brent crude oil spot and futures prices. Gas prices refer to the Dutch TTF gas spot and futures prices. Electricity prices refer to the average wholesale spot and futures price for the five largest euro area countries. The “synthetic” future price for EU Emissions Trading System allowances (EUA) is derived as the end-of-month linearly interpolated value of the two nearest European Energy Exchange (EUA futures). Monthly EUA futures prices are then averaged to produce an equivalent to annual frequency. Bilateral exchange rates are assumed to remain unchanged over the projection horizon at the average levels prevailing in the ten working days ending on the cut-off date. Revisions are expressed as percentages for levels and as percentage points for growth rates and percentages per annum.
2 Real economy
Economic activity in the euro area recovered in the first quarter of 2024, partly driven by temporary factors (Chart 1).[3] Eurostat’s flash estimate of quarterly growth in the first quarter of this year was 0.3%. This was 0.2 percentage points higher than expected in the March projections, while the figure for the fourth quarter of 2023 was revised down by 0.1 percentage points. The positive surprise in the first quarter was likely related to a boost from net trade, following a temporary decline in the fourth quarter of 2023. The unusually mild winter also temporarily supported housing investment in some countries. Across sectors, value added in industry likely contracted in the first quarter of 2024, while value added in services expanded.
Chart 1
(quarter-on-quarter percentage changes, seasonally and working day-adjusted quarterly data)
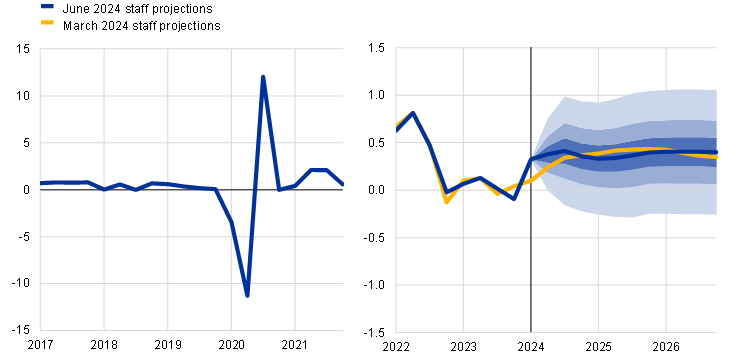
Notes: Historical data may differ from the latest Eurostat publications. The vertical line indicates the start of the current projection horizon. The ranges shown around the central projections provide a measure of the degree of uncertainty and are symmetric by construction. The ranges are based on past projection errors, after adjustment for outliers. The bands, from darkest to lightest, depict the 30%, 60% and 90% probabilities that the outcome of real GDP growth will fall within the respective intervals. For more information, see the box entitled “Illustrating the uncertainty surrounding the projections” in the March 2023 ECB staff macroeconomic projections for the euro area.
Real GDP is expected to strengthen further during 2024, supported by increasing household incomes, foreign demand and some recovery in business investment. The continued growth in real disposable income is expected to support private consumption, which should become the main driver of growth from the second quarter onwards. Developments in monthly indicators – such as gradually increasing consumer confidence, further strengthening in the Purchasing Managers’ Index indicators for services activity and new orders to May and the March increase in retail sales volumes – are consistent with such a recovery in household spending. Robust real wage growth, in the context of a tight labour market, should underpin households’ purchasing power throughout the year, supported by an expected recovery in confidence. Business investment is projected to broadly stagnate in average annual terms in 2024, with some recovery being observed during the year, mostly reflecting the waning but still present drag from past monetary policy tightening. At the same time, it will be supported by the recovery in domestic and foreign demand, with foreign demand also lifting export growth. The normalisation of the inventory cycle is also projected to yield a neutral contribution to growth in the second half of 2024, after a significant negative contribution at the turn of the year. Finally, the short-term outlook for euro area real GDP growth is expected to be boosted considerably by the impact of the activities of multinational enterprises in Ireland, following negative impacts during 2023.
Over the medium term, real GDP growth will be supported by rising real incomes, strengthening foreign demand and the waning impact of monetary policy tightening. The peak impact of monetary policy tightening is expected in 2024, despite market expectations of a reduction in interest rates. The withdrawal of fiscal support measures introduced since 2022 to compensate for high inflation and energy prices will, overall, have a small negative impact on growth in 2024-26. At the same time, government consumption and investment will contribute positively to GDP growth.
Financing conditions, especially high levels of interest rates, are expected to continue to have a strong negative impact on growth, but this will fade over the projection horizon. The impact of the monetary policy measures taken since December 2021 continues to feed through to the real economy, affecting the growth outlook, particularly for 2024.[4] On the basis of market expectations regarding the future path of interest rates (Box 1), the negative impact of monetary policy on economic growth is expected to start fading gradually during 2024. These effects, together with the fading of the negative impact from the observed tightening in credit standards since the end of 2022, will support the economic recovery.
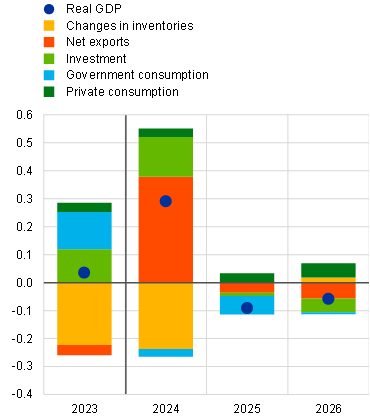
Compared with the March 2024 projections, real GDP growth has been revised up 0.3 percentage points for 2024, down by 0.1 percentage points for 2025 and remained unrevised for 2026 (Table 3 and Chart 2). The revisions for 2024 reflect the positive surprise in the first quarter of the year driven by net trade and the improvement in some forward-looking survey indicators, offsetting somewhat more negative carry-over effects from lower growth in the fourth quarter of 2023. The marginal downward revision for 2025 mainly relates to a downward revision to government consumption in light of a tighter fiscal policy stance.
Chart 2
Euro area real GDP growth – decomposition into the main expenditure components
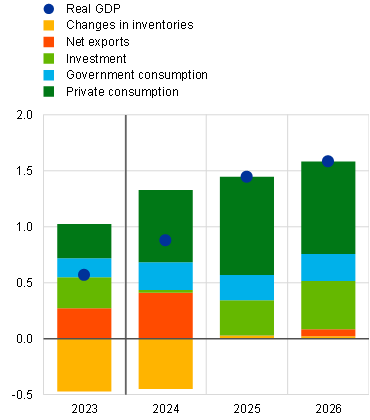
Turning to the components of real GDP, real private consumption is expected to be the main driver of economic growth, supported by robust growth in real incomes on the back of rising wages and falling inflation, despite a relatively high saving ratio. Private consumption should recover gradually in the course of 2024 and grow at annual rates of 1.6-1.7% in 2025-26, markedly above the pre-pandemic average of 1.2%. This recovery is driven by rising real disposable income, mainly from strong wage growth and robust non-labour income (i.e. income from self-employment and from financial assets). In the near term, the saving ratio will remain relatively high in line with high frequency soft data on future saving intentions, still heightened but declining economic uncertainty, high interest rates and tighter credit access. Moreover, the saving ratio will continue to be supported by the typically low propensity to consume out of non-labour income. In the medium term, growth in real incomes is expected to moderate as the catch-up in real wages gradually slows but this should be largely offset by a decline in the saving ratio. As uncertainty and inflationary pressures are expected to recede further and consumer spending behaviour to normalise gradually, the saving ratio should start to edge down from the end of 2024. However, it is projected to remain above its pre-pandemic average over the projection horizon, as higher interest rates are likely to keep providing incentives for households to save. In addition, wealth effects are also expected to support the recovery of private consumption.
Housing investment is projected to decline further during 2024, before slowly recovering in the course of 2025 as the negative effects of the tightening of financing conditions gradually ease and household incomes continue to rise robustly. After three consecutive quarters of decline, housing investment is likely to have picked up in the first quarter of 2024, supported by the unusually mild winter, particularly in Germany. As this special effect is fading and demand for housing remains weak (exacerbated by a significant fiscal incentive expiring in Italy), housing investment is expected to resume its downward trend in the second quarter of 2024. However, with the fading impact of past rises in mortgage lending rates, a recovery in house prices and the robust rise in household incomes, housing investment is projected to start recovering as of mid-2025. Overall, following a further significant fall in 2024 and a slight decline in 2025, housing investment is likely to increase on an annual basis in 2026, for the first time since 2022.
Business investment is projected to recover in the coming quarters, amid improving demand, the fading drag from adverse financing conditions, crowding-in effects from the Next Generation EU (NGEU) programme funds and increasing green and digital investment. Euro area business investment (excluding volatile Irish intellectual property products) contracted strongly in the second half of 2023, with declining confidence, the winding-down of previous order backlogs, lower internal financing buffers and tighter financing conditions. A recovery is projected from the beginning of 2024, in line with expectations of strengthening domestic and foreign demand. Crowding-in effects from the NGEU programme funds (which, in some countries, have been postponed towards the end of the projection horizon) and ongoing private sector efforts to enhance green and digital investment will contribute to the recovery, as will the fading drag from adverse financing conditions.
After a period of negative growth, euro area trade is expected to improve as exports grow with foreign demand. Euro area real exports are estimated to have rebounded in the first quarter of 2024 and by more than expected in the March projections. Over the projection horizon real exports are expected to grow broadly in line with developments in foreign demand. Compared with the March projections, the export market share has been revised down over the projection horizon and is expected to remain well below pre-pandemic levels. This is due to the competitiveness challenges related to the past appreciation of the euro and to the past energy shocks, since the euro area is more affected by higher energy commodity prices than its trading partners. Imports are projected to recover slightly faster than domestic demand as the trade-intensive components of demand, such as investment, recover. Overall, net trade is expected to have a neutral contribution to growth over the projection horizon. The terms of trade are projected to improve only slightly over the projection horizon given that the effect of the energy shock has mostly worked its way through. From 2024, the current account balance is projected to recover further, to levels just below 3% of GDP but slightly above its pre-pandemic average (2.6%).
Table 3
Real GDP, trade and labour market projections for the euro area
(annual percentage changes, unless otherwise indicated; revisions in percentage points)
|
|
June 2024 |
Revisions vs March 2024 | ||||||
|---|---|---|---|---|---|---|---|---|
| Real GDP | 0.6 | 0.9 | 1.4 | 1.6 | 0.1 | 0.3 | -0.1 | 0.0 |
| Private consumption | 0.6 | 1.2 | 1.7 | 1.6 | 0.1 | 0.0 | 0.1 | 0.1 |
| Government consumption | 0.8 | 1.2 | 1.1 | 1.1 | 0.6 | -0.1 | -0.3 | -0.1 |
| Investment | 1.3 | 0.1 | 1.5 | 2.0 | 0.5 | 0.7 | -0.1 | -0.3 |
|
Exports1) |
-0.9 | 1.3 | 2.9 | 3.1 | -0.2 | 0.3 | 0.0 | -0.1 |
|
Imports1) |
-1.4 | 0.5 | 3.2 | 3.3 | -0.1 | -0.5 | 0.1 | 0.1 |
| Contribution to GDP from: | ||||||||
|
Domestic demand |
0.8 | 0.9 | 1.4 | 1.5 | 0.3 | 0.1 | -0.1 | 0.0 |
|
Net exports |
0.3 | 0.4 | 0.0 | 0.1 | 0.0 | 0.4 | 0.0 | 0.0 |
|
Inventory changes |
-0.5 | -0.5 | 0.0 | 0.0 | -0.3 | -0.3 | 0.0 | 0.0 |
| Real disposable income | 1.2 | 1.9 | 1.1 | 1.2 | 0.3 | 0.3 | 0.0 | 0.1 |
| Household saving ratio (% of disposable income) | 14.5 | 15.0 | 14.5 | 14.2 | 0.1 | 0.2 | 0.1 | 0.1 |
|
Employment2) |
1.4 | 0.8 | 0.4 | 0.5 | 0.0 | 0.3 | 0.1 | 0.1 |
| Unemployment rate | 6.5 | 6.5 | 6.5 | 6.3 | 0.0 | -0.2 | -0.1 | -0.3 |
| Current account (% of GDP) | 1.6 | 2.8 | 2.9 | 2.9 | -0.2 | -0.4 | -0.3 | -0.2 |
Notes: Real GDP and components refer to seasonally and working day-adjusted data. Historical data may differ from the latest Eurostat publications owing to data releases after the cut-off date for the projections. Data are available for downloading, also at quarterly frequency, from the Macroeconomic Projection Database on the ECB’s website.
1) This includes intra-euro area trade.
2) Persons employed.
The labour market is seen to remain resilient, although the pace of growth in employment should slow in comparison with recent years. Employment grew by 0.3% in the first quarter of 2024 according to Eurostat’s flash estimate, again surprising to the upside (in the March projections employment was expected to remain stable). Growth in employment is expected to decline from 1.4% in 2023 to 0.8% in 2024 and to stabilise at 0.4% and 0.5% in 2025 and 2026 respectively. The current level of employment is above the level implied by a dynamic Okun’s law. However, it is projected to converge to the level implied by the Okun’s law relationship during 2026 (Chart 3, panel a). This pattern reflects that cyclical factors (such as labour hoarding and high profit levels of firms) that have supported employment more than usual over the recent past are expected to gradually fade away.[5] Employment growth has been revised up by a cumulative 0.5 percentage points in 2024-26 compared with the March projections. This increase reflects the upward surprise in early 2024 and a somewhat improved outlook for labour force developments on account of recent positive data.
Chart 3
Employment and productivity
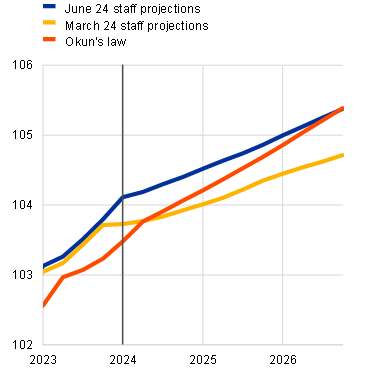
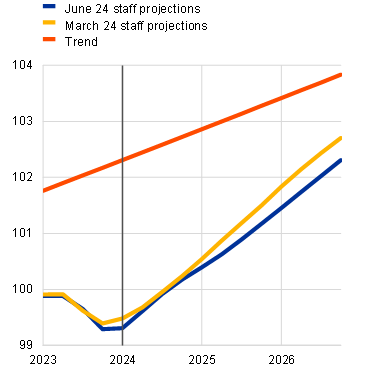
Notes: Panel a): Okun’s law refers to the level of employment derived using an Autoregressive Distributed Lag (1,1) model with a dummy for the second and third quarters of 2020 and the June 2024 projections for real GDP. Panel b): the trend of productivity is computed using the average of quarterly growth rates over the sample 2000-19. The vertical lines indicate the start of the projection horizon.
Labour productivity growth is expected to strengthen over the projection horizon, but productivity levels in 2026 are seen to remain significantly below the long-term linear trend. Stronger growth in employment, in an environment of relatively muted real GDP growth, has recently left growth in productivity subdued. Over the projection horizon, productivity is expected to recover, following a slightly downward revised path compared with the March projections. While productivity growth of 1.0% in 2025 and 1.1% in 2026 seems relatively strong – nearly double the historical average (2000-19) – it should be seen against the especially low annual average growth of -0.1% since the pandemic (2020-23). This is also mirrored in the level of productivity, which remains significantly below what would have been implied by historical trend growth, using the pre-pandemic average annual growth rate of 0.6% as a benchmark (Chart 3, panel b).
The unemployment rate is expected to remain relatively stable until the end of 2025 and then to fall further to a new historical low in 2026 (Chart 4). It is expected to hover around 6.5% in 2024 and 2025 and to decline to 6.3% in 2026, an all-time low. The unemployment rate has been revised down by 0.2 percentage points, on average over the projection horizon, partly on account of recent data being more positive and a somewhat more robust employment outlook.
Chart 4
Unemployment rate
(percentage of labour force)
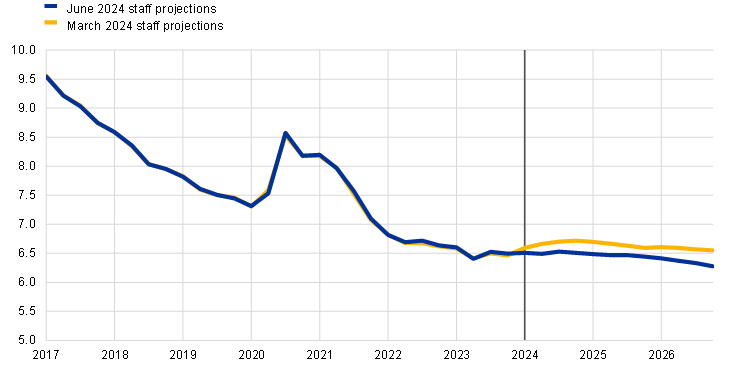
Note: The vertical line indicates the start of the projection horizon. Historical data may differ from the latest Eurostat publications.
3 Fiscal outlook
The euro area fiscal stance is expected to tighten over the projection horizon, particularly in 2024 (Table 4).[6] A downward surprise in the 2023 budget outcome is explained mainly by a loosening of the fiscal stance by 0.3 percentage points of GDP compared with the estimates in the March 2024 projections, largely on account of higher than expected expenditure growth. In 2024 the fiscal stance is projected to tighten significantly, owing mainly to the withdrawal of a large part of the energy and inflation support measures. A further tightening of the fiscal stance, albeit at a much slower pace, is projected for 2025-26, on the back of a further scaling down of the remaining energy support in 2025, slower growth in subsidies and other fiscal transfers, and some measures on the revenue side. These effects are expected to be partly compensated by limited increases in government investment. In addition to these discretionary fiscal policy measures, non-discretionary factors – including revenue windfalls/shortfalls – are expected to have a relatively limited impact on the stance over the projection horizon, after large swings in recent years. Relative to the March 2024 projections, the euro area fiscal stance entails somewhat more tightening over 2025-26, mainly on account of less dynamic expenditure growth, which in part reflects the temporary nature of the 2023 fiscal slippage.
Table 4
Fiscal outlook for the euro area
(percentage of GDP; revisions in percentage points)
1) The fiscal policy stance is measured as the change in the cyclically adjusted primary balance net of government support to the financial sector. The figures shown are also adjusted for grants under the Next Generation EU (NGEU) programme on the revenue side. A negative (positive) figure implies a loosening (tightening) of the fiscal stance.
2) Calculated as the government balance net of transitory effects of the economic cycle and measures classified under the European System of Central Banks definition as temporary.
The euro area budget balance is set to improve over the projection horizon, while the debt ratio is projected to broadly stabilise. After the larger than expected outcome for 2023, the euro area deficit is projected to decline, falling below the 3% of GDP reference value as of 2025. This is mainly due to a decrease in the cyclically adjusted primary deficit over the whole projection horizon, and particularly in 2024, which is expected to outweigh the increase in interest payments. Compared with the March 2024 projections, the budget balance has been revised down for 2024 (i.e. a larger deficit is expected), mainly reflecting the base effects from 2023. However, the 2026 budget balance is expected to turn out somewhat above the March projections (i.e. to show a smaller deficit), reflecting an upward revision in the cyclically adjusted primary balance and a better cyclical component. The euro area debt-to-GDP ratio is seen to broadly stabilise over the projection horizon as continuous (though declining) primary deficits and positive deficit-debt adjustments are compensated by favourable (negative) interest rate-growth differentials. Compared with the March 2024 projections, the debt ratio is slightly lower for 2024, with the unfavourable base effect from 2023 more than compensated by a significantly more favourable interest rate-growth differential owing to upward revisions in nominal GDP growth. The debt-to-GDP ratio has been revised down slightly for 2026, mostly on account of the improved primary balance.
4 Prices and costs
Headline HICP inflation is projected to move broadly sideways during 2024, before declining to 2.2% in 2025 and 1.9% in 2026 (Chart 5). Headline HICP inflation declined from an average of 5.4% in 2023 to 2.4% in April 2024. It is expected to hover around 21% in the coming quarters, with some volatility related primarily to base effects in energy prices. HICPX inflation is expected to be sluggish in its moderation, with little change over the rest of 2024. The persistence in HICPX inflation, which will remain above the historical average over the projection horizon, reflects mainly slowly easing services inflation. Given that food inflation is also seen to decline further only later in the horizon and energy inflation will mostly make a small positive contribution to HICP inflation, this implies a slow disinflationary path for headline inflation, which is expected to reach the 2% inflation target in the fourth quarter of 2025 (one quarter later than in the March projections).
Chart 5
Euro area HICP inflation
(annual percentage changes)
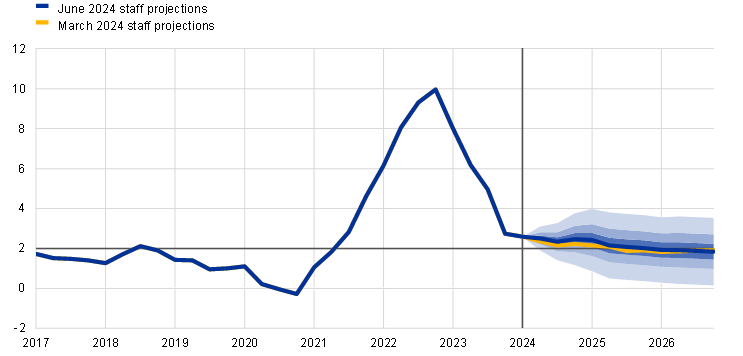
Notes: The vertical line indicates the start of the current projection horizon. The ranges shown around the central projections provide a measure of the degree of uncertainty and are symmetric by construction. They are based on past projection errors, after adjustment for outliers. The bands, from darkest to lightest, depict the 30%, 60% and 90% probabilities that the outcome of HICP inflation will fall within the respective intervals. For more information, see the box entitled “Illustrating the uncertainty surrounding the projections” in the March 2023 ECB staff macroeconomic projections for the euro area.
Table 5
Price and cost developments for the euro area
(annual percentage changes, revisions in percentage points)
|
June 2024 |
Revisions vs March 2024 | |||||||
|---|---|---|---|---|---|---|---|---|
| HICP | 5.4 | 2.5 | 2.2 | 1.9 | 0.0 | 0.2 | 0.2 | 0.0 |
| HICP excluding energy | 6.3 | 2.8 | 2.3 | 2.1 | 0.0 | 0.1 | 0.1 | 0.1 |
| HICP excluding energy and food | 4.9 | 2.8 | 2.2 | 2.0 | 0.0 | 0.2 | 0.1 | 0.0 |
| HICP excluding energy, food and changes in indirect taxes | 5.0 | 2.7 | 2.2 | 2.0 | 0.1 | 0.1 | 0.1 | 0.0 |
| HICP energy | -2.0 | -0.8 | 1.0 | 0.3 | 0.0 | 0.8 | 0.5 | -0.3 |
| HICP food | 10.9 | 3.0 | 2.7 | 2.2 | 0.0 | -0.2 | 0.4 | -0.1 |
| GDP deflator | 6.0 | 3.3 | 2.4 | 2.0 | 0.1 | 0.4 | 0.1 | 0.1 |
| Import deflator | -2.9 | -0.2 | 2.0 | 1.9 | 0.1 | 0.2 | -0.4 | -0.3 |
| Compensation per employee | 5.2 | 4.8 | 3.5 | 3.2 | -0.1 | 0.3 | -0.1 | 0.2 |
| Productivity per employee | -0.9 | 0.1 | 1.0 | 1.1 | -0.1 | 0.0 | -0.2 | -0.1 |
| Unit labour costs | 6.1 | 4.7 | 2.5 | 2.1 | -0.1 | 0.3 | 0.2 | 0.4 |
|
Unit profits1) |
6.2 | 0.1 | 1.9 | 1.6 | 0.4 | 1.1 | -0.1 | -0.5 |
Notes: The GDP and import deflators, unit labour costs, compensation per employee and labour productivity refer to seasonally and working day-adjusted data. Historical data may differ from the latest Eurostat publications owing to data releases after the cut-off date for the projections. Data are available for downloading, also at quarterly frequency, from the Macroeconomic Projection Database on the ECB’s website.
1) Unit profits are defined as gross operating surplus and mixed income (adjusted for the income of the self-employed) per unit of real GDP.
Following some volatility in the coming quarters, energy inflation is projected to remain muted over the medium term, as assumed declines in energy commodity prices are partly offset by climate-related fiscal measures. Energy inflation is expected to turn positive again in the second quarter of 2024, owing to upward base effects, the unwinding of government energy compensation measures and recent increases in crude oil prices. Between April 2024 and March 2025, the upward base effects account for most of the expected shift in energy inflation. In addition, the unwinding of energy and inflation compensatory fiscal measures between December 2023 and February 2025 is estimated to contribute 0.4 percentage points to headline inflation in 2024 and 0.1 percentage points in 2025. Once these base effects and the impact from the withdrawal of the energy-related fiscal measures fade, downward-sloping energy commodity price futures curves, partly offset by some upward impacts from climate-related fiscal measures, imply only very small positive contributions from HICP energy inflation in 2025 and 2026 (Chart 6).[7]
Chart 6
Euro area HICP inflation – decomposition into the main components
(annual percentage changes, percentage point contributions)
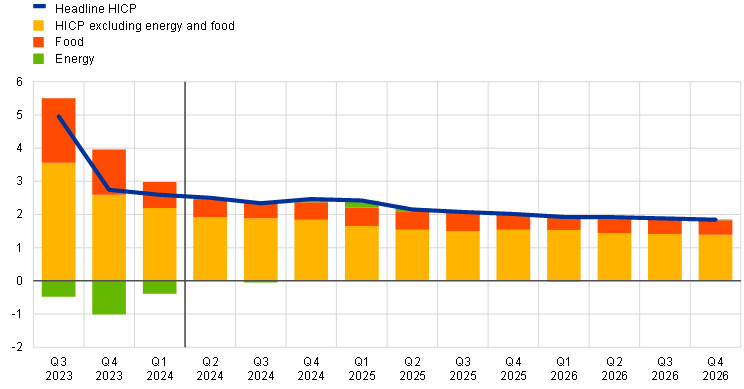
Note: The vertical line indicates the start of the current projection horizon.
Food inflation should remain broadly stable in the near term and decline moderately further, thereafter, as pipeline pressures from past increases in input costs ease. Food inflation continued to fall in the first few months of this year to stand at 2.8% in April, down from an average of 10.9% in 2023 on account of developments in both processed and unprocessed food components. To a large extent, this was due to easing pipeline pressures in view of lower energy and food commodity prices. Following an expected sidewards movement over the remainder of this year and most of 2025, food inflation is projected to decline slightly further to an average of 2.2% in 2026, owing to the lagged impact of continued dynamic labour cost pressures over the last two years of the projection horizon.
HICPX inflation is expected to decline gradually, to stand at 2.0% in 2026, owing mainly to a moderate unwinding of services inflation (Chart 7). Non-energy industrial goods (NEIG) inflation declined from an average of 5.0% in 2023 to 0.9% in April 2024, whereas the decline in services inflation was more moderate – from 4.9% in 2023 to 3.7% in April 2024. Declines in NEIG inflation since the beginning of 2024 stem from fading upward impacts from supply bottlenecks, indirect effects from past increases in energy and food prices and the downward impact from monetary policy tightening continuing to feed through. The projections include only negligible impacts from geopolitical tensions in the Middle East (including disruption to Red Sea shipping) on goods inflation, consistent with shipping costs being a small share of total goods costs, the relatively contained increase seen so far and the fact that these costs are based on longer-term contracts. In the medium term, the decline in HICPX inflation mainly relates to services inflation as post-pandemic reopening effects unwind and the as the downward impact from monetary policy tightening continues to feed through. A faster unwinding of services inflation is seen to be hindered by declining but still elevated upward pressures from labour cost developments.
Chart 7
Euro area HICP inflation excluding energy and food
(annual percentage changes)

Notes: The vertical line indicates the start of the current projection horizon. The ranges shown around the central projections provide a measure of the degree of uncertainty and are symmetric by construction. They are based on past projection errors, after adjustment for outliers. The bands, from darkest to lightest, depict the 30%, 60% and 90% probabilities that the outcome of HICPX inflation will fall within the respective intervals. For more information, see the box entitled “Illustrating the uncertainty surrounding the projections” in the March 2023 ECB staff macroeconomic projections for the euro area.
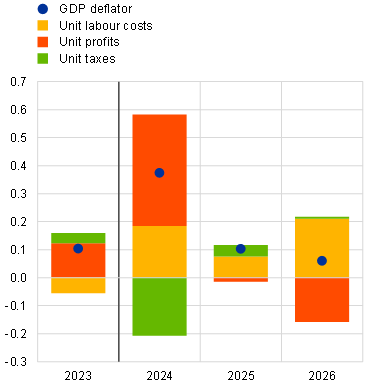
Compared with the March 2024 projections, the outlook for headline HICP inflation has been revised up by 0.2 percentage points for 2024 and 2025, owing mainly to upward revisions in HICP energy inflation and HICPX inflation, and is unrevised for 2026 (Chart 8). The upward revision to HICP energy inflation in 2024 is attributable mainly to higher energy commodity prices and, to a smaller extent, to changes in taxes and network and distribution charges. The upward revision to HICPX inflation is explained by data surprises in recent months, especially due to higher outcomes in HICP services inflation. These upward revisions are partly compensated by a downward revision to HICP food inflation, mainly on account of lower than expected recent data outturns. For 2025, food inflation has been revised up, reflecting higher than previously expected inflationary pressure from energy and labour costs. Later in the projection horizon, the upward revision to HICPX inflation also reflects the pass-through of higher unit labour costs. Headline inflation for 2026 is unrevised as a result of small upward revisions to HICPX inflation being offset by small downward revisions to food and energy inflation.
Chart 8
Revisions to the inflation projection compared with the March 2024 projections
(percentage point contributions)

Nominal wage growth is projected to decline gradually but remain elevated, allowing real wages to catch up with the levels prevailing before the inflation surge (Chart 9). Annual growth in compensation per employee stood at 4.7% in the fourth quarter of 2023. For 2024, it is projected to stand at 4.8%, on average, with some volatility during the year. It is then expected to continue moderating over the projection horizon while remaining above historical levels owing to still tight labour markets, inflation compensation and increases in minimum wages. Both negotiated wages and the wage drift are expected to make stronger contributions to compensation per employee growth than before the pandemic. Negotiated wage growth is seen to increase slightly in 2024, before easing gradually, with tight labour markets behind a more persistent contribution from the wage drift. In 2026 growth in compensation per employee is seen at 3.2%, somewhat exceeding the sum of projected productivity growth and HICP inflation. Compared with the March projections, the growth rate in compensation per employee has been revised up slightly for 2024 and 2026. This upward revision reflects the impact of incoming data, a slightly better cyclical position and a higher wage drift, and is in line with a tighter labour market, especially towards the end of the projection horizon. Real wages are expected to return to early 2022 levels in the third quarter of 2024, one quarter earlier than in the March 2024 projections.
Chart 9
Compensation per employee
(annual percentage changes)

Note: The vertical line indicates the start of the current projection horizon. Historical data may differ from the latest Eurostat publications.
Growth in unit labour costs is projected to decline notably. Unit labour cost growth should have peaked in 2023, when it averaged 6.1%, and it is expected to fall sharply to 2.1% in 2026. While it benefits from the projected rise in productivity growth coupled with the decline in wage growth, it will remain notably above the pre-pandemic average of 1.5%. Compared with the March staff projections, growth in unit labour costs has been revised up, especially for 2025 and 2026. This reflects the upward revision in compensation per employee and a downward revision in productivity growth.
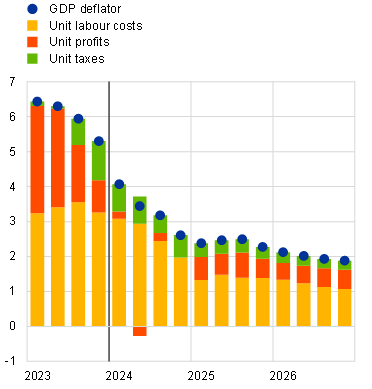
Domestic price pressures, as measured by the growth of the GDP deflator, are projected to continue to decrease, with profit growth first providing a buffer for high labour cost pressure and subsequently recovering (Chart 10). The annual growth rate of the GDP deflator is projected to continue to decline quickly in the course of 2024, averaging 3.3% in 2024 and easing more gradually thereafter to an average of 2.0% in 2026. Unit profit growth peaked in early 2023 and has since slowed, with the outturn in the fourth quarter of 2023 below the expectations of the March projections. It is expected to remain notably below growth in unit labour costs throughout 2024, which implies that profit margins are buffering the relatively strong labour cost growth. As growth in unit labour costs moderates, unit profit growth is expected to recover somewhat as of 2025, helped by the economic recovery and strengthening productivity growth. Compared with the March projections, growth in the GDP deflator has been revised up for 2024 on account of upward surprises in incoming data for the first quarter of 2024, likely due to significantly higher unit profit growth. It has also been revised up marginally for 2025 and 2026, owing to higher unit labour cost growth, which in 2026 is partly offset by downward revisions to unit profits.
After a negative annual rate in 2024, import price inflation is expected to hover around 2% in the outer years of the projection horizon. Growth in the import deflator is expected to increase from -2.9% in 2023 to -0.2% in 2024, 2.0% in 2025 and 1.9% in 2026, broadly in line with the projection pattern for export competitors’ prices and the path of energy prices (see Section 1 and Box 2).
Chart 10
Domestic price pressures
5 Sensitivity and scenario analyses
Alternative energy price paths
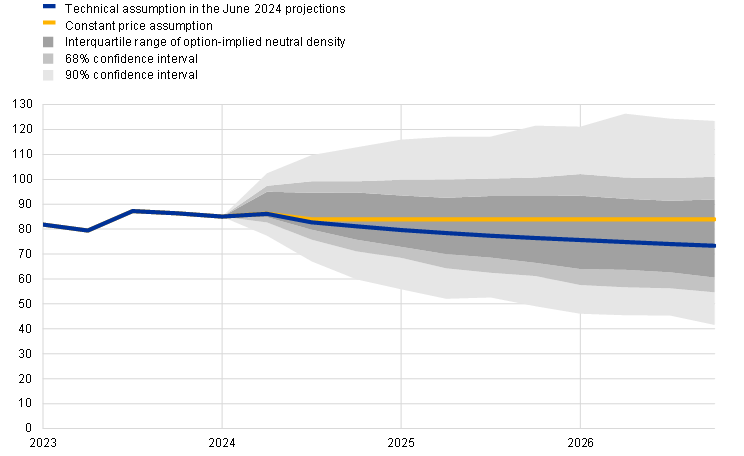
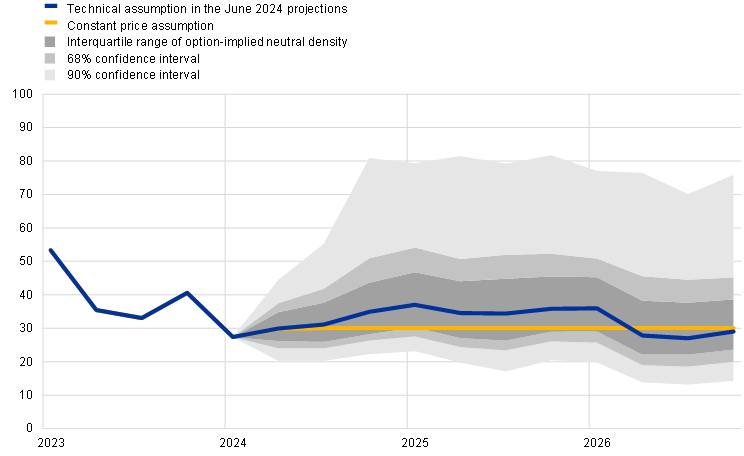
Future energy commodity price developments are very uncertain, and alternative paths for oil and gas commodity prices would have a significant impact on the economic outlook, especially for inflation. While the staff projections are based on the technical assumptions outlined in Box 1, this sensitivity analysis is used to derive alternative downside and upside paths from the 25th and 75th percentiles of the option-implied neutral densities for both oil and gas prices.[8] Both the oil price and gas price distributions indicate upside risks to the technical assumptions used in the June 2024 projections (Chart 11). In addition, a constant price assumption is considered for the prices of both oil and gas. In each case, a synthetic energy price index (a weighted average of the oil and gas price paths) is computed, and the impacts of the alternative paths are assessed using a range of ECB and Eurosystem macroeconomic models employed in the projections. The average impacts on real GDP growth and HICP inflation across these models are shown in Table 6.
b) Gas price assumption
(EUR/MWh)
Sources: Morningstar and ECB calculations.
Note: Option-implied densities for oil and gas prices are extracted from market quotes on 15 May 2024 for options on ICE Brent Crude and Dutch TTF Natural Gas Futures with fixed quarterly expiry dates.
Table 6
Impacts of alternative energy price paths
|
Path 1: 25th percentile |
Path 2: 75th percentile |
Path 3: constant prices | |||||||
|---|---|---|---|---|---|---|---|---|---|
|
(deviation from baseline levels, percentages) |
|||||||||
| Oil prices | -2.9 | -10.9 | -15.8 | 10.3 | 19.5 | 23.9 | 1.3 | 7.7 | 12.8 |
| Gas prices | -12.7 | -20.6 | -19.1 | 16.3 | 27.8 | 33.4 | -4.9 | -15.1 | 0.4 |
| Synthetic energy price index | -10.6 | -16.0 | -16.0 | 13.9 | 22.9 | 24.3 | -0.6 | -0.4 | 8.7 |
|
(deviations from baseline growth rates, percentage points) |
|||||||||
| Real GDP growth | -0.1 | 0.1 | 0.0 | 0.0 | -0.2 | -0.1 | 0.0 | 0.0 | 0.0 |
| HICP inflation | -0.2 | -0.4 | -0.2 | 0.4 | 0.7 | 0.4 | 0.0 | 0.0 | 0.2 |
Notes: In this sensitivity analysis, a synthetic energy price index that combines oil and gas futures prices is used. The 25th and 75th percentiles refer to the option-implied neutral densities for the oil and gas prices on 15 May 2024. The constant oil and gas prices take the respective value as at the same date. The macroeconomic impacts are reported as averages of a number of ECB and Eurosystem staff macroeconomic models.
Box 2
Could China export disinflation?
This box considers alternative scenarios on China’s economic policies to bolster domestic growth and whether they may end up exporting disinflation to the euro area and the United States. In the June 2024 Eurosystem staff projections, China’s growth is projected to slow gradually over the projection horizon, weighed down by a struggling property sector. However, the manufacturing sector has been expanding because of supportive policy measures, as credit is flowing despite high levels of inventories and falling rates of capacity utilisation. Moreover, China’s export market share (in volume terms) has remained above its pre-pandemic levels (Chart A). Initially, this was supported by the pandemic-related shift in global consumption from services to goods, given China’s leading position in global merchandise trade in general and in products in demand during the pandemic in particular. However, despite the reversal of these pandemic-related effects on a global scale, China’s market share has increased by around 18% since early 2023, while the prices of its exports have declined further. This sets China apart from both the US economy, which has seen its market share return to pre-pandemic levels, and the euro area, which has not yet fully made up the losses in its market share since 2020.
Chart A
Export market shares
(volume indices; January 2010 = 100)
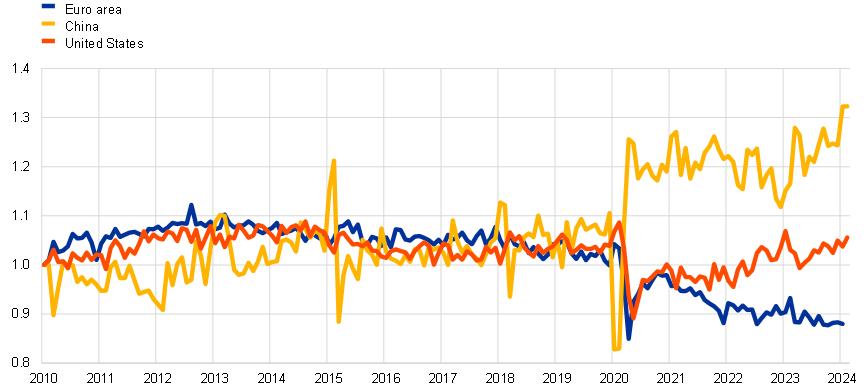
Sources: CPB World Trade Monitor, Eurostat (via Haver Analytics) and ECB staff calculations.
Notes: The indicators refer to export market shares in volumes of global goods. All series are seasonally adjusted by Haver Analytics. The latest observations are for February 2024.
The euro area has stronger trade ties with China than the United States has. On the import side, the United States – previously more dependent on China than the euro area – reduced imports of Chinese goods from 2.8% of GDP in the early 2010s to 2.3% of GDP in the period 2019-20. Euro area imports of Chinese goods, however, moved in the opposite direction and more recently amounted to 3.5% of GDP. On the export side, the euro area remains more export-dependent on China than the United States, with 2.5% of euro area GDP being accounted for by exports to China, compared with 1.1% of US GDP in the case of the United States.
Three scenarios around the June 2024 baseline growth projections for China are explored: (i) an upside scenario, in which China achieves higher growth through credit support to the manufacturing sector, thus boosting domestic and foreign demand as exports become cheaper; (ii) a downside scenario, in which lower Chinese domestic demand owing to a steeper downturn in the residential sector is partially offset by higher exports supported by subsidies; and (iii) an adverse scenario, which is similar to the downside scenario but assumes that all economies except the euro area introduce trade barriers against China in response to Chinese subsidised exports. In this scenario, the euro area would remain the only large market open to Chinese exports. These scenarios are simulated using the ECB-Global model.
The scenarios imply spillovers from China to euro area and US inflation via several channels. In all scenarios under consideration, China’s falling export prices have a direct downward impact on import prices in the euro area and the United States through final and intermediate imports. They also dampen euro area and US foreign demand via a competitiveness channel, as the trading partners of the two economies divert their import demand towards China. In addition, there is a domestic expenditure switching channel, whereby domestic consumers substitute towards cheaper goods imports from China. This further reduces the demand for domestic firms’ goods, putting downward pressure on producer prices, and hence on inflation, owing to lower labour demand and wages. Ultimately, it also affects service prices. Changes in demand for goods from China would also affect global demand and commodity prices, thereby also transmitting to euro area inflation.
In the upside scenario, the impact on GDP and inflation is positive but relatively muted for both the euro area and the United States (Chart B). In terms of GDP impact, the adverse competitiveness effects from lower export prices in China, which lead to a reduction in both domestic production and foreign demand in the euro area and in the United States, are offset by the higher demand from China. Similarly, the impact of lower non-energy import prices is offset by higher oil prices and higher demand (both on account of higher Chinese demand) and spillovers turn out to be slightly positive for US and euro area inflation.
Chart B
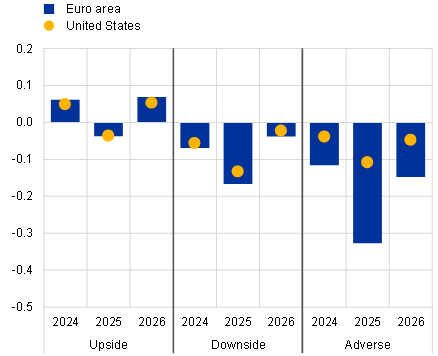
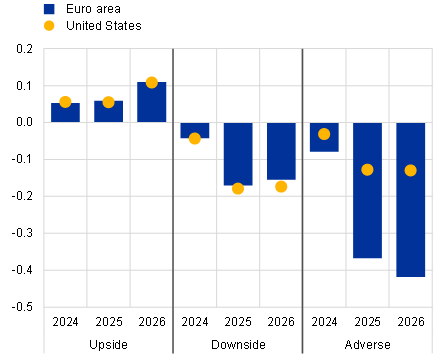
In the downside scenario, China could indeed export disinflation (Chart C). In this scenario, the inflation dampening effect of export subsidies is compounded by lower global activity and foreign demand in the United States and the euro area as China’s economy experiences a downturn. Foreign demand falls more strongly in the United States, as the US dollar appreciates in this scenario owing to a flight-to-safety effect in light of the global downturn. Non-oil import price inflation falls by up to 70 basis points in the United States and by slightly less in the euro area (as US dollar-denominated import prices fall less in euro terms). The compounded effects of lower demand and lower export prices in China exert downward pressure on real GDP and inflation both in the euro area and in the United States. Consequently, the growth impact on the euro area is estimated at 0.17 percentage points in 2025, only slightly above the 0.13 percentage points estimated for the United States. The euro area economy’s significantly larger export share of GDP to China would suggest a heavier drag on GDP than in the case of the United States. However, the appreciation of the US dollar in this scenario implies an additional drag on US output. Consumer price inflation would be roughly 20 basis points lower for both economies in 2025 under the assumption that monetary policy is exogenous. The effects on the euro area would be slightly larger if the euro were not to depreciate.
The adverse scenario entails the largest negative impacts for the euro area, with inflation falling by up to 40 basis points. In this scenario the effects are particularly severe, as China’s cheaper exports affect only the euro area, thus crowding out its domestic production. There is also a negative impact on the United States owing to trade diversion towards the euro area, as the latter benefits from cheaper inputs imported from China. The same effect helps cushion the adverse impact of cheap Chinese exports on euro area GDP. Euro area consumer price inflation falls by close to 40 basis points in this scenario.
Inflation spillovers are transmitted mainly through the trade channel but oil prices also play a significant role. A decomposition of euro area inflation impact by transmission channel shows that trade linkages play a major role in the downside scenario and the adverse scenario, while financial linkages are less important. In the upside scenario, the oil price increases by 2.5% relative to baseline, while in the other two scenarios the price falls by a similar amount. Overall, the oil price changes contribute a significant 10 basis points to the inflation spillover to the euro area.
Chart C
Decomposition of the impact on euro area headline consumer price inflation
(percentage point deviations from baseline growth rates)

Source: ECB staff calculations using the ECB-Global.
Notes: A decomposition is achieved by running the ECB-Global with the corresponding spillover channel deactivated. The residual captures complementarities between the channels.
Box 3
Alternative paths for euro area productivity developments and their impact on the economy
Employment in 2023 was strong relative to output, supported by several cyclical factors. Firms created or at least held on to jobs in an environment of stronger profit margins, subdued growth in real wages, a dynamic labour force (also supported by immigration) and a decline in average hours worked. These factors were behind the comparatively strong growth in total employment during the period from the fourth quarter of 2022 to the fourth quarter of 2023. Employment turned out stronger than the level implied by real GDP growth according to a model based on Okun’s law. In turn, labour productivity declined in 2023. In the June 2024 projections, employment growth as of the first quarter of 2024 is below the growth implied by Okun’s law.[9] The projections entail a gradual return to the long-run relationship, implying that productivity will improve with a recovery in GDP growth. Notwithstanding the improvement, the baseline still sees productivity growth below what would be expected based on average GDP growth over the last two decades. As such, while a cyclical recovery in productivity growth is assumed in the baseline, productivity growth could also be driven down by factors weighing more permanently on productivity, such as hysteresis effects or delays in the digital and green transitions. However, it cannot be excluded that productivity may also recover faster than currently foreseen – stimulated, for instance, by artificial intelligence (AI).
In this vein, two scenarios have been considered in order to assess alternative labour productivity paths vis-a-vis the baseline:
- Scenario 1 represents a more optimistic dynamic for productivity than that embedded in the baseline. It assumes a faster unwinding of past cyclical drivers that have supported employment, such as a fading of labour hoarding and a reduction of the incentives for firms to hire. This implies weaker employment growth over the projection horizon, such that labour productivity is above the current staff projections baseline. This scenario assumes that employment growth will be subdued with respect to real GDP growth to compensate for the buoyant employment dynamic experienced since the recovery from the pandemic. In this scenario, employment is 0.5 percentage points lower in cumulative terms over the projection horizon, while trend productivity is unchanged compared with the baseline.
- Scenario 2 adopts a more pessimistic outlook, assuming that there are structural factors adversely affecting capital and total factor productivity (TFP). This more pessimistic scenario reflects the possibility that hysteresis effects from past low demand reduce the need to enhance production capacities, implying lower increases in the capital stock, possibly related to high energy prices or geopolitical tensions and consequent supply chain issues. In this scenario, firms may adjust their capacities and enhance their capital stock at a slower pace. Other structural factors at play might also influence trend TFP. These include possible delays in the productivity benefits from digital technologies or, over the medium term, a more negative impact of environmental policies than that embedded in the baseline staff projections. The scenario assumes that trend output growth is 0.4 percentage points lower than in the baseline for each year from 2024 to 2026. This implies that the level of trend output is 1.2% lower in 2026 than in the baseline, representing a lower capital stock and lower trend TFP, while trend labour is unchanged. Therefore, the level of trend productivity is also 1.2% lower in 2026.
Table A
Main features of the scenarios
The scenarios are evaluated via the ECB-BASE model and the New Area-Wide Model (NAWM) II to assess a range of possible macroeconomic implications (Table B). Scenario 1 is interpreted through the ECB-BASE model. The alternative employment path is implemented within the model as a negative labour demand shock, which can also be interpreted as an unfolding of labour hoarding. The more pessimistic employment outlook in Scenario 1 would lead to a 0.2% cumulated loss of real GDP by the end of the horizon compared with the baseline, driven by lower income and production, with only minor impacts on HICP inflation. Scenario 2 is first implemented via an additional negative labour productivity shock in the production function of ECB-BASE, lowering the trend output produced by the factor labour. Compared with the baseline, the output gap in this scenario is less negative in 2024-25 than the baseline. It even turns positive in 2026, which leads to upward pressures on prices as production adjusts to the reduced capacity. According to this model (Scenario 2a), HICP inflation is 0.1 percentage points (0.2 percentage points) above the baseline in 2025 (in 2026) and real GDP growth is 0.2 percentage points (0.3 percentage points) lower in 2025 (in 2026). As a robustness check, Scenario 2 is also implemented using the NAWM II, via a transitory technology (TFP) shock (Scenario 2b). In this scenario agents internalise the lower TFP in their decisions, leading to a stronger impact on GDP than in Scenario 2a, which uses the ECB-BASE model. The results for inflation are similar to those in Scenario 2a, given the price rigidities in the NAWM II and the sluggish response to inflation (Table B). In both Scenario 2a and Scenario 2b, employment is similar to the baseline.[10]
All in all, the two scenarios depict potential risks to the baseline projections. No probability is attached to the likelihood that each scenario materialises, but the design of these two potentially different outcomes helps to highlight the macroeconomic consequences of different developments in labour productivity.[11]
Table B
Effects on macroeconomic variables
(percentage point deviations from baseline growth rates)
|
|
Real GDP growth |
HICP inflation |
Ex-post implied labour productivity | |||||||||
|---|---|---|---|---|---|---|---|---|---|---|---|---|
|
cumul. |
cumul. |
cumul. | ||||||||||
| Scenario 1: ECB-BASE model labour demand shock | 0.0 | -0.1 | -0.1 | -0.2 | 0.00 | 0.00 | -0.01 | -0.02 | 0.0 | 0.2 | 0.1 | 0.3 |
| Scenario 2a: ECB-BASE model productivity shock | 0.0 | -0.2 | -0.3 | -0.5 | 0.01 | 0.08 | 0.17 | 0.25 | -0.1 | -0.2 | -0.3 | -0.6 |
| Scenario 2b: NAWM II transitory technology shock | -0.1 | -0.3 | -0.4 | -0.9 | 0.03 | 0.11 | 0.16 | 0.30 | -0.2 | -0.4 | -0.5 | -1.1 |
Notes: The ECB-BASE model was simulated keeping fiscal and monetary policies, and exchange rate and financial spreads, fixed to their baseline values. For Scenario 1, the model simulation is conditioned on the employment path; for Scenario 2a, it is conditioned on the trend output path by letting (labour) productivity of the production function adjust. Relative to the baseline, the shift in trend output increases the slack measure and lifts prices via the Phillips curve relationship. Lower trend output also implies an adverse adjustment in the real wage target and thus leads to lower real (and nominal) wages. The wage adjustments in turn lead to more employment endogenously ex post. With a lag, lower trend output eventually leads to a decrease in production and expenditures. The Scenario 2b NAWM II simulation was carried out via unanticipated shocks on the transitory technology shock, which implies that short-term rates increase. A lower transitory technology shock triggers an increase in marginal costs, leading to a rise in domestic prices. With domestic demand adjusting only sluggishly to the decrease in supply, both employment and nominal wages rise. At the same time, the appreciation caused by the higher interest rates, gives rise to lower import prices and, therefore, the increase in consumer prices is smaller than the increase in domestic prices. Ex post implied labour productivity refers to the real GDP in the scenario divided by employment in the scenario, i.e. after endogenous adjustments through the models.
Box 4
Comparison with forecasts by other institutions and the private sector
The June 2024 Eurosystem staff projections are generally at the upper end or slightly above the range of other forecasts, except for headline inflation in 2026. For 2024 and 2026, the staff growth projection is slightly above the forecasts of other institutions and surveys of private sector forecasters while, for 2025, it is close to the average of other available forecasts. As regards HICP inflation, for 2024, the Eurosystem staff projection is slightly above most other forecasts, in some cases likely due to more up-to-date information on energy prices. For 2025, it is – together with the recent OECD forecast – at the top of a rather narrow range. For 2026, the Eurosystem staff inflation projection is the only one to deviate from 2.0%, at 1.9%. Regarding HICP inflation excluding energy and food, the Eurosystem staff projection is slightly above the narrow range of other forecasters for 2024 and 2025.
Table
Comparison of recent forecasts for euro area real GDP growth, HICP inflation and HICP inflation excluding energy and food
(annual percentage changes)
|
|
Date of release |
GDP growth |
HICP inflation |
HICP inflation excl. energy and food | ||||||
|---|---|---|---|---|---|---|---|---|---|---|
| Eurosystem staff projections | June 2024 | 0.9 | 1.4 | 1.6 | 2.5 | 2.2 | 1.9 | 2.8 | 2.2 | 2.0 |
| Consensus Economics | May 2024 | 0.6 | 1.4 | 1.5 | 2.3 | 1.9 | 2.0 | 2.6 | 2.1 | - |
| European Commission | May 2024 | 0.8 | 1.4 | - | 2.5 | 2.1 | - | 2.7 | 2.1 | - |
| OECD | May 2024 | 0.7 | 1.5 | - | 2.3 | 2.2 | - | 2.6 | 2.1 | - |
| IMF | April 2024 | 0.8 | 1.5 | 1.4 | 2.4 | 2.1 | 2.0 | - | - | - |
| Survey of Professional Forecasters | April 2024 | 0.5 | 1.4 | 1.4 | 2.4 | 2.0 | 2.0 | 2.6 | 2.1 | 2.0 |
Sources: Consensus Economics Forecasts, 16 May 2024 (data for 2026 are taken from the April 2024 survey); European Commission Spring 2024 Economic Forecast, 15 May 2024; OECD Economic Outlook, 2 May 2024; IMF World Economic Outlook, 16 April 2024; ECB Survey of Professional Forecasters, 12 April 2024.
Notes: These forecasts are not directly comparable with one another or with the Eurosystem staff macroeconomic projections, as these were finalised at different points in time. Additionally, they use different methods to derive assumptions for fiscal, financial and external variables, including oil, gas and other commodity prices. The Eurosystem staff macroeconomic projections report working day-adjusted annual growth rates for real GDP, whereas the European Commission and the IMF report annual growth rates that are not adjusted for the number of working days per annum. Other forecasts do not specify whether they report working day-adjusted or non-working day-adjusted data.
Postal address 60640 Frankfurt am Main, Germany
Telephone +49 69 1344 0
Website www.ecb.europa.eu
All rights reserved. Reproduction for educational and non-commercial purposes is permitted provided that the source is acknowledged.
For specific terminology please refer to the ECB glossary (available in English only).
PDF ISBN 978-92-899-6577-4, ISSN 2529-4687, doi:10.2866/13580, QB-CF-24-001-EN-N
HTML ISBN 978-92-899-6575-0, ISSN 2529-4687, doi:10.2866/815658, QB-CF-24-001-EN-Q
-
The cut-off date for technical assumptions was 15 May 2024. The projections for the global economy were finalised on 16 May and the macroeconomic projections for the euro area were finalised on 22 May. Eurostat published the flash estimate for euro area HICP inflation for May on 31 May. This estimate was fully in line with the June 2024 Eurosystem staff projections for headline inflation. The current projection exercise covers the period 2024-26. Projections over such a long horizon are subject to very high uncertainty, and this should be borne in mind when interpreting them. For further information, see the article entitled “The performance of the Eurosystem/ECB staff macroeconomic projections since the financial crisis”, Economic Bulletin, Issue 8, ECB, 2019. A full database of past ECB and Eurosystem staff macroeconomic projections is available from the Macroeconomic Projection Database on the ECB’s website. This database includes many variables at quarterly frequency.
-
References to world and/or global aggregates of economic indicators throughout this section exclude the euro area.
-
Eurostat’s first breakdown of real GDP growth in the first quarter of 2024 will not be published until after the finalisation of the June 2024 projections. The breakdown mentioned here is based on preliminary information from some euro area countries and estimates by Eurosystem staff.
-
Estimates of this impact are surrounded by considerable uncertainty; see the box entitled “A model-based assessment of the macroeconomic impact of the ECB’s monetary policy tightening since December 2021”, Economic Bulletin, Issue 3, ECB, 2023.
-
See Arce, O. and Sondermann, D., “Low for long? Reasons for the recent decline in productivity”, ECB Blog, 6 May 2024.
-
The euro area fiscal stance is defined as the change in the cyclically adjusted primary balance, with data on the revenue side adjusted for Next Generation EU (NGEU) grants (see the notes to Table 4).
-
See also “Assessing the macroeconomic effects of climate change transition policies”, Economic Bulletin, Issue 1, ECB, 2024.
-
The market prices used are those prevailing on 15 May 2024 (the cut-off date for the technical assumptions).
-
The Okun’s law relationship is estimated using an autoregressive distributive lag – ARDL (1,1) – model, with a dummy imposed in the second and third quarters of 2020 to disregard the large swings in the two quarters most affected by the pandemic.
-
Given the sluggish response of domestic demand to the decline in supply, employment and nominal wages both increase.
-
Note that the models are symmetric in their reaction to positive and negative shocks, so a reaction to an opposite scenario of what is included in the box would bring results that are symmetric to what is discussed here.

