US Treasury market conditions and global market reactions to US monetary policy
Prepared by Magdalena Grothe, Ana-Simona Manu and Peter McQuade
Published as part of the ECB Economic Bulletin, Issue 8/2023.
The market for US Treasury securities is the largest and most liquid market for government securities in the world. With over USD 25 trillion of outstanding securities, this market is used to finance the US Government and plays a central role in the implementation of the monetary policy of the US Federal Reserve System. US Treasury securities also act as a key benchmark for both US domestic private sector financing and international markets. As such, changes in liquidity conditions in this market can have noticeable consequences for global financial markets.
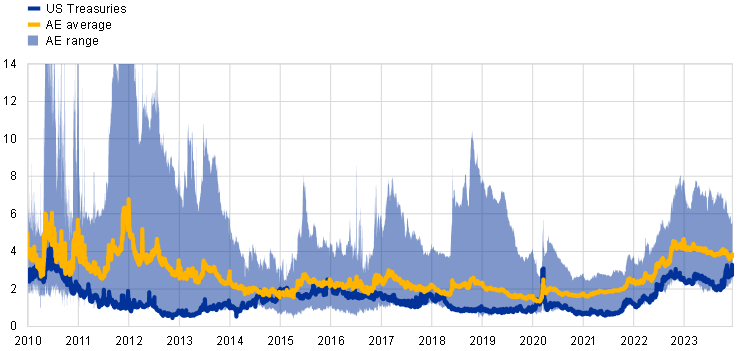
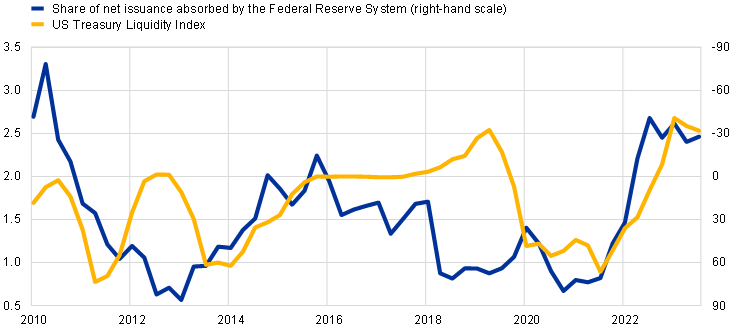
Recently, liquidity in the US Treasury market has declined owing to a combination of factors. Chart A (panel a) shows the evolution of bond market liquidity in selected advanced economies, including the US Treasury market, as measured by the “spline spread”, which is the average fitting error in a yield curve. This spread serves as a proxy for the extent of arbitrage opportunities in a bond market, with higher values being associated with lower market liquidity.[1] The smooth functioning of the US Treasury market has been challenged on a number of occasions in recent years, particularly in March 2020 at the onset of the pandemic. More recently, monetary policy tightening (including reduced absorption of US Treasuries by the Federal Reserve System, as shown by the blue line in Chart A, panel b) and elevated uncertainty about inflation and growth are likely to have contributed to declining liquidity and increased the sensitivity of US and global sovereign bond markets.[2]
Chart A
Liquidity developments in sovereign bond markets
a) Spline spreads on US Treasuries and sovereign bonds of selected other major advanced economies
(percentages)
b) US Treasury spline spreads and Federal Reserve System absorption of US Treasury issuance
(left-hand scale: index values; right-hand scale: percentages (reversed))
Sources: Bloomberg, Haver and ECB staff calculations.
Notes: Panel a): the yield curve “spline spread” measures the sum of absolute values of the deviation between the observed yield curve and a cubic spline interpolation. This indicator captures the presence of arbitrage opportunities, a feature of illiquid markets, and is one of several market liquidity indicators that are typically highly correlated with each other. An increase in the spread denotes lower liquidity. Other advanced economies (AE) include Canada, France, Germany, Italy, Japan, Spain and the United Kingdom. In 2011/12 the maximum values of the spline spread reached around 25 basis points, but this is not shown on the chart for reasons of readability. Panel b): the share of net issuance absorbed by the Federal Reserve System is computed as a four-quarter average. The liquidity index displays the average yield error across the universe of US Treasury notes and bonds with remaining maturity of one year or more. The right-hand scale is reversed such that higher values denote lower absorption of US Treasury issuances.
Latest observations: panel a) 15 December 2023; panel b) third quarter of 2023.
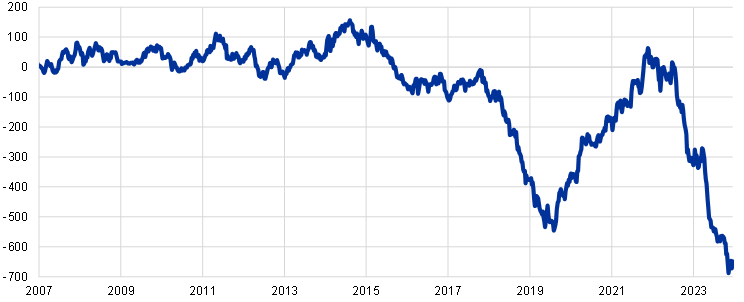
Leveraged fund activity in the US Treasury futures market could also be amplifying market sensitivity to new information. The net short positions of leveraged funds in the US Treasury futures market have reached historically high levels of around USD 650 billion, of which around USD 300 billion is at two-year maturity (Chart B).[3] This may be related to several trading strategies, such as the “cash-futures basis trade” or directional trades betting on rate increases.[4] Although this activity could in principle help maintain liquidity in the Treasury spot market, it has been suggested that, at times, it might potentially exacerbate market sensitivity.[5]
Chart B
Leveraged funds’ speculative positions in US Treasury futures
Net position in US Treasury futures
(USD billions)
Sources: Bloomberg, Commodity Futures Trading Commission and ECB staff calculations.
Notes: The chart shows the sum of net positions in two, five and ten-year US Treasury futures held by leveraged funds. Net positions refer to the value of long positions minus the value of short positions.
Latest observation: 15 December 2023.
The effect of a US monetary policy shock on bond prices may vary depending on conditions in the US Treasury market. Empirical analysis explores whether US Treasury market conditions might be relevant for the strength of the bond market impact of a US monetary policy shock. The empirical set-up focuses on the impact of US monetary policy shocks because these are usually a major driver of global financial conditions. Local projection methods are used to examine how the effects on bond markets vary depending on the conditions in the US Treasury market. Two types of state dependence are analysed. The first approach examines whether the impact of US monetary policy differs depending on the level of US Treasury market liquidity, measured by the “spline spread”, i.e. the difference between the observed yield curve and a spline interpolated curve (as shown in Chart A). The second approach examines whether the effect of US monetary policy differs depending on the size of net positions held by leveraged funds in US Treasury futures contracts (as shown in Chart B). US monetary policy shocks are identified in a daily Bayesian vector autoregression (BVAR) model using sign restrictions and are calibrated to an average 10 basis point tightening of the ten-year US Treasury yield over one week.[6] The local projection estimation controls for changes in stock market volatility and economic activity and includes a dummy variable to control for the pandemic period.
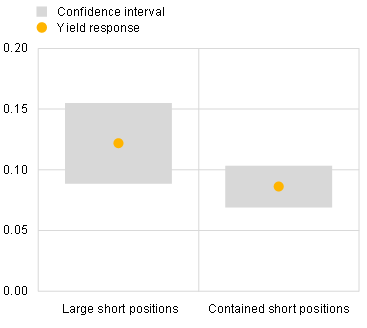
The analysis suggests that the impact of a US monetary policy shock is larger when market liquidity is low or when leveraged short positions are large. The effect of a US monetary policy shock on two-year US Treasury yields is larger when US Treasury market liquidity is relatively low (Chart C, panel a).[7] This is consistent with previous studies suggesting that financial markets tend to become more sensitive to information when market liquidity is limited.[8] Similarly, the effect of a US monetary policy shock on two-year US Treasury yields tends to be larger when leveraged funds have relatively large net short positions in US Treasury futures (Chart C, panel b).[9] The 68% confidence intervals of the estimated effects overlap somewhat, indicating that, while market sensitivity to shocks varies across states, the difference in the effects is not always significant.
Chart C
Impact of a US monetary policy shock depending on US Treasury market conditions
Estimated response of two-year US Treasury yields depending on:
Sources: Bloomberg Finance L.P., Refinitiv and ECB staff calculations.
Notes: The yellow dots represent the mean estimate of the response of two-year US Treasury yields to a monetary policy shock. The shock corresponds to around a 10 basis point tightening in the ten-year US Treasury yield over one week and is estimated in a daily BVAR model using a combination of sign and relative magnitude restrictions. Impulse responses are shown at impact and are estimated using local projections allowing for state dependence, following Ramey, V. and Zubairy, S., “Government Spending Multipliers in Good Times and in Bad: Evidence from US Historical Data”, Journal of Political Economy, Vol. 126(2), April 2018, pp. 850-901, with the state transition parameter gamma assumed to be 2. The estimation employs weekly data over the period 2010-23, controlling for economic activity, funding conditions, interest rates and market uncertainty (measured by the Citigroup Economic Surprise Index, the spread between the ten-year and two-year US Treasury rates, the financial conditions index, the VIX and the MOVE), and includes a crisis dummy for the outbreak of the pandemic during February-May 2020. The states are defined on the basis of liquidity in the US Treasury market (panel a) and net positions of leveraged funds in US Treasury futures contracts (panel b). Shaded areas refer to 68% confidence intervals based on Newey-West standard errors.
Latest observation: September 2023.
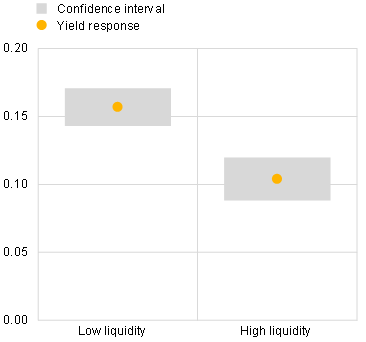
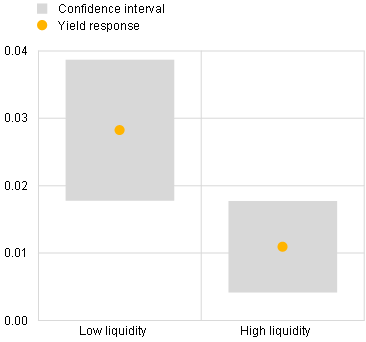
The results also provide some evidence that US Treasury market conditions can amplify bond market reactions to US monetary policy in other countries. The effect of a US monetary policy shock on bond markets in other advanced economies is found to be slightly larger when liquidity conditions in US Treasury markets are tighter than normal (Chart D, panels a and b).[10] This could be related to the significant role of US Treasuries in various trading strategies and benchmark pricing, as well as the fact that a deterioration in liquidity in US markets might also be related to declining global market liquidity.
Chart D
Estimated yield response in other advanced economies to a US monetary policy shock depending on liquidity conditions in the US Treasury market
Sources: Bloomberg Finance L.P., Refinitiv and ECB staff calculations.
Notes: The yellow dots represent the mean estimate of the response of long-term yields (panel a) and short-term rates (panel b) of advanced economies to a US monetary policy shock. The shock corresponds to around a 10 basis point tightening in the ten-year US Treasury yield over one week and is estimated in a daily BVAR model using a combination of sign and relative magnitude restrictions. Impulse responses are shown after one week and are estimated over the period 2010-23 by local projections allowing for state dependence. The coefficient estimates of the local projections are reported conditional on the state of the US Treasury market. The state of US Treasury market liquidity is defined using a proxy based on the average yield errors of US Treasury bonds from a fitted Treasury curve. Additional controls include the VIX equity market volatility index, the US and global Citi Economic Surprise indices, and lags of the dependent variable. Shaded areas refer to 68% confidence intervals based on Newey-West standard errors.
Latest observation: September 2023.
Overall, the empirical analysis suggests that both domestic and global bond market reactions to US monetary policy might be stronger under certain US Treasury market conditions. These findings could help explain part of the relatively large adjustments in US Treasury yields observed during 2023, as declining Treasury market liquidity might be one of the factors contributing to higher yield sensitivity. The empirical results also illustrate the link between US Treasury market conditions and the broader sensitivity of bond markets to monetary policy.
Liquidity is also inversely related to volatility as, all else being equal, market makers widen their bid-ask spreads and post less depth in order to manage the increased risk associated with taking a position when volatility is high. See Fleming, M., “How Has Treasury Market Liquidity Evolved in 2023?”, Liberty Street Economics, 17 October 2023.
For details on factors contributing to the current low liquidity, see Quarterly Review, Bank for International Settlements (BIS), September 2023; Global Financial Stability Review, International Monetary Fund, October 2023, Chapter 1; and Duffie, D., “Dealer Capacity and US Treasury market functionality”, BIS Working Papers, No 1138, BIS, October 2023.
Leveraged funds are typically hedge funds whose strategies may involve taking outright positions or arbitrage within and across markets. A short position in a bond futures contract is profitable if the bond price falls.
The cash-futures basis trade involves taking a short position in Treasury futures, taking a long position in Treasury cash and borrowing in the repo market to finance the trade. It has been linked to the severe US Treasury market illiquidity known as the “dash for cash” in March 2020. See Vissing-Jorgensen, A., “The Treasury Market in Spring 2020 and the Response of the Federal Reserve”, Journal of Monetary Economics, Vol. 124, November 2021, pp. 19-47; and Schrimpf, S., Shin, H.S. and Sushko, V., “Leverage and margin spirals in fixed income markets during the Covid-19 crisis”, BIS Bulletin, No 2, BIS, April 2020.
For instance, increased sensitivity might be related to the fact that such trading strategies are generally highly leveraged and exposed to changes in repo rates and futures margins. See also Avalos, F. and Sushko, V., “Margin leverage and vulnerabilities in US Treasury futures”, BIS Quarterly Review, BIS, September 2023, Box A; and Barth, D., Kahn, R.J. and Mann, R., “Recent Developments in Hedge Funds’ Treasury Futures and Repo Positions: is the Basis Trade “Back”?”, FEDS Notes, Board of Governors of the Federal Reserve System, August 2023.
For more detail on the daily BVAR model, see Brandt, L., Saint Guilhem, A., Schröder, M. and Van Robays, I., “What drives euro area financial market developments? The role of US spillovers and global risk”, Working Paper Series, No 2560, ECB, May 2021.
A US monetary policy shock of a magnitude corresponding to an average 10 basis point impact on the ten-year US Treasury yield results in around a 13 basis point rise in two-year US Treasury yields after one week when liquidity is low, but around a 7 basis point increase when US Treasury market liquidity is relatively high.
See, for example, Guimaraes, R., Pinter, G. and Wijnandts, J.C., “The liquidity state-dependence of monetary policy transmission”, Staff Working Papers, No 1045, Bank of England, October 2023; de Vette, N., Klaus, B, Kördel, S. and Sowiński, A., “Why market and funding liquidity matter and how they interact”, Financial Stability Review, ECB, May 2023, Special Feature A, Section 2; and Adrian, T. and Shin, H.S., “Liquidity, Monetary Policy, and Financial Cycles”, Current Issues in Economics and Finance, Vol. 14, No 1, Federal Reserve Bank of New York, January/February 2008.
The estimates point to around a 12 basis point rise in two-year Treasury yields in response to a monetary policy shock when leveraged funds’ net short positions are substantial, compared to around a 9 basis point rise when these short positions are relatively contained.
A US monetary policy shock is associated with an increase of around 16 basis points in foreign long-term yields and around 3 basis points in foreign short-term rates, when US Treasury market liquidity is tighter than normal, as compared to around 10 and 1 basis points, respectively, in normal liquidity conditions.

